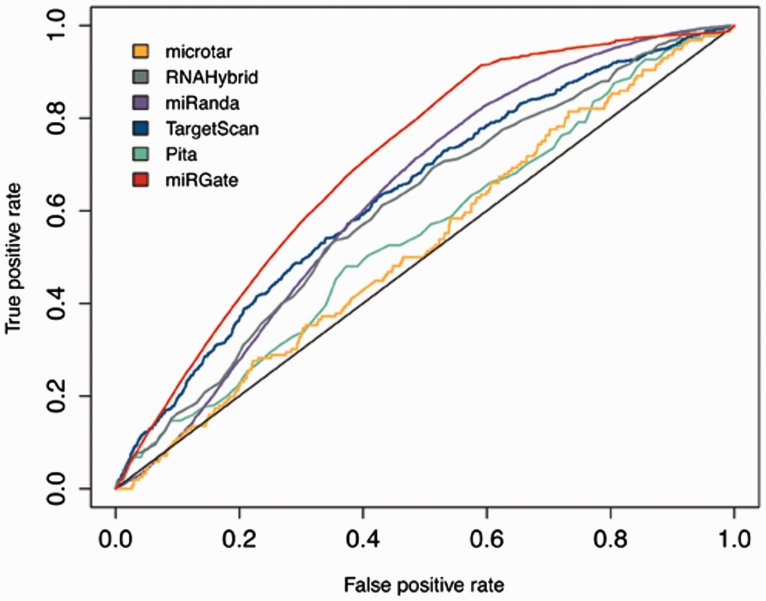
Figure 3.
ROC curve illustrating the performance of miRGate and each individual method separately, over four datasets of validated targets: OncomirDB, miRecords, Tarbase and miRTarBase. The AUC obtained for each method is: microtar: 0.528, RNAHybrid: 0.609, miRanda: 0.632, TargetScan: 0.638, Pita: 0.548 and miRGate: 0.704.

