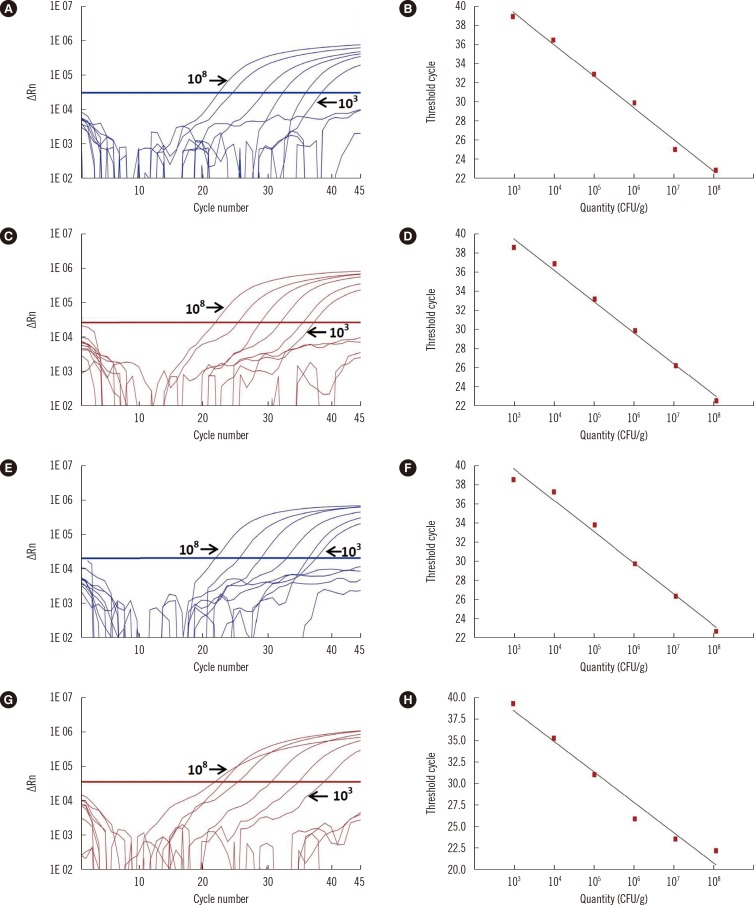
Fig. 1. Amplification curves and dilution end-point standard curves of log10 genome equivalents versus threshold cycle number. The analytical sensitivity of this assay for tpi (A-B), tcdA (C-D), tcdB (E-F), and cdtA (G-H) was approximately 103 CFU/g.
Abbreviations: CFU, colony forming unit; ΔRn, normalized reporter.

