Figure 1.

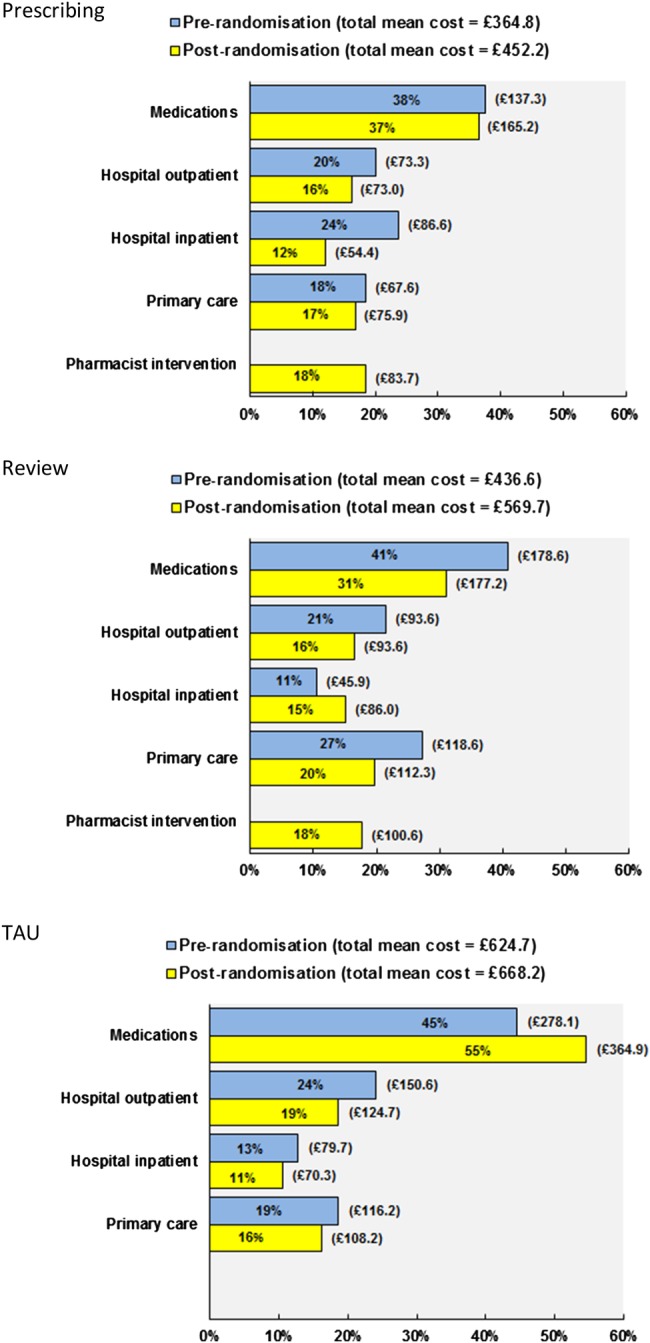
Proportion of unadjusted total mean costs per patient prerandomisation (ie baseline) and at 6 months follow-up, by each main cost component and study arm.

Proportion of unadjusted total mean costs per patient prerandomisation (ie baseline) and at 6 months follow-up, by each main cost component and study arm.