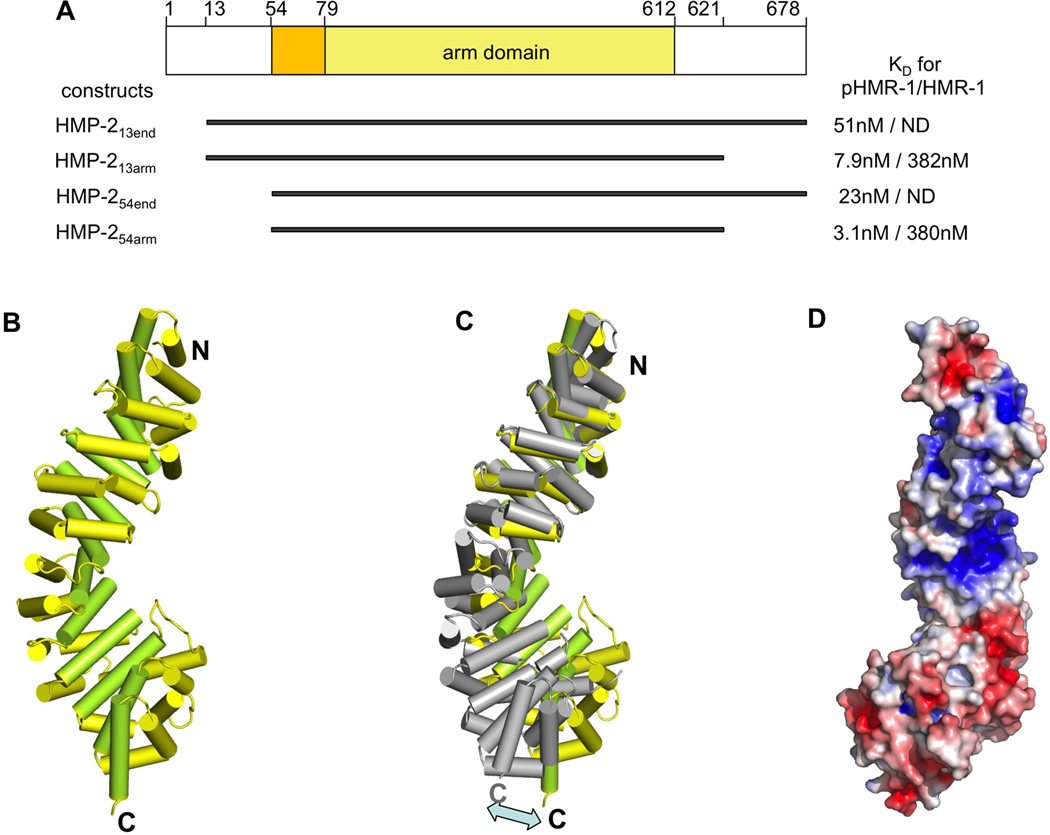
Figure 1. HMP-2 structure and dependence of binding on the phosphorylation state of HMR-1.
(A) Four constructs of HMP-2, which were used in our study, are shown and their residue boundaries indicated. On the right side of each construct, KD values for pHMR-1cyto80 and HMR-1cyto80, measured by ITC experiments are shown. HMP-213end and HMP-254end did not give measurable ITC signals for the interaction with HMR-1cyto80 and are labeled as ND.
(B) Structure of HMP-254arm (residues 77–613). Helices 1 and 2 of each arm repeat are colored yellow, and helix 3 is colored light green. The structures of HMP-254arm and HMP-254end are very similar except for the N-terminal region. Residues 56–79 are seen only in the HMP-254end structure, and form an extra N-terminal helix whose position appears to be a consequence of crystal packing.
(C) Superposition of arm repeats 1 to 4 of HMP-2 and mouse β-catenin (PDB ID 1I7W). HMP-2 helices are colored as in Figure 2A and β-catenin is colored grey.
(D) Electrostatic surface of the HMP-2 arm domain, with negative and positive regions colored red and blue, respectively. Contoured at ± 5 kBT/e.

