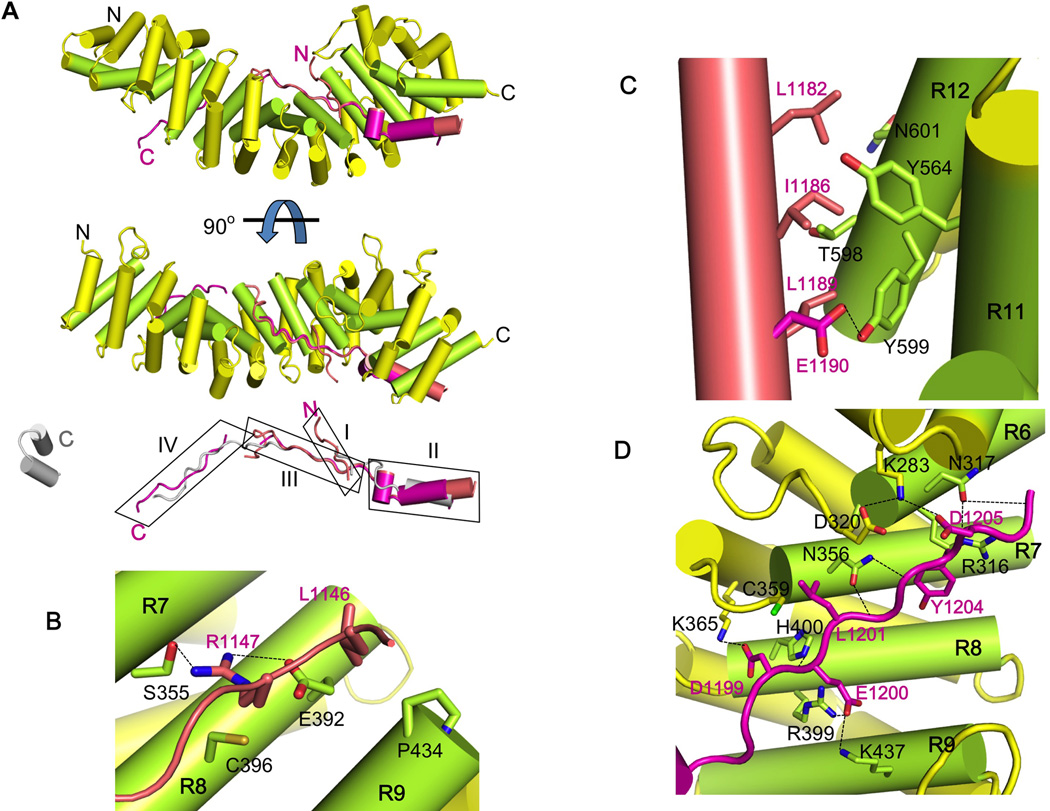
Figure 3. Crystal structure of HMP-254arm/pHMR-1cyto80 complex identifies key interaction regions.
In each panel, the arm domain colored as in Figure 1B and the structures of pHMR-1cyto80 are shown in salmon (conformation A from the high-resolution P43 crystal form) and magenta (conformation B).
(A) Ribbon diagram of the complex. The N and C terminus of each protein is labeled. Phosphorylated Ecyto is aligned to pHMR-1cyto80 and shown in grey. The four regions of pHMR-1 are boxed and labeled as I, II, III and IV.
(B) Interaction region I. Arm repeats 7, 8 and 9 are labeled as R7, R8 and R9. Side chains of amino acids that make direct contacts between HMP-2 and pHMR-1cyto are shown as sticks, and HMP-2 and pHMR-1 residues are labeled in black and magenta, respectively. Hydrogen bonds are shown as dotted lines.
(C) Interaction region II.
(D) Interaction region III. Most of the contacts between HMP-2 and pHMR-1cyto are formed by side chains, except for N317, N356, and H400 of HMP-2, which form hydrogen bonds with amide and carbonyl groups of a polypeptide backbone of pHMR-1cyto.

