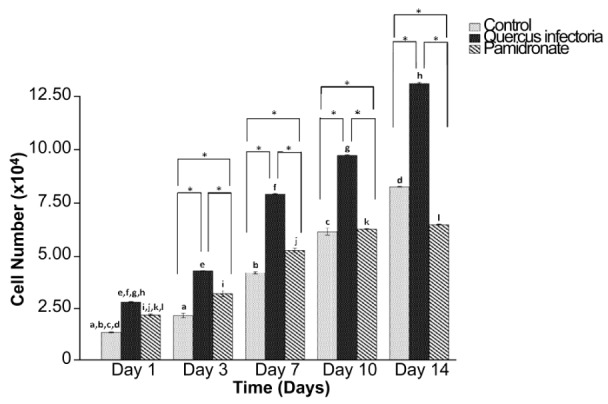
Figure 6:

Cell number (×104) after 1, 3, 7, 10, and 14 days of incubation. The values of the bars represented mean ± standard deviation (SD) of the three independent experiments. * Significant difference between the three groups within the same day (P < 0.05) by one-way ANOVA and Tukey’s test. Days that share the same letter showed a significant difference (within the same group) (P < 0.05) by one-way ANOVA and Tukey’s test.
