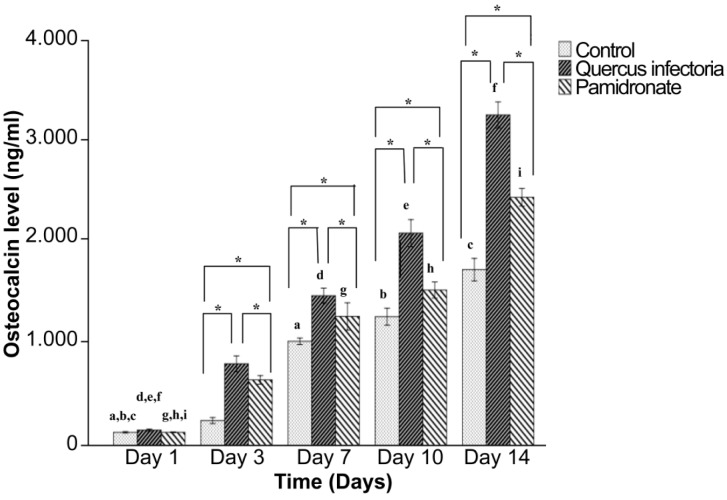
Figure 8:
Osteocalcin level of hFOB 1.19 cells; untreated hFOB 1.19 cells (control), hFOB 1.19 cells- treated Quercus infectoria and hFOB 1.19 cellstreated pamidronate after 1, 3, 7, 10, and 14 days of incubation. The values of the bars represented mean (SD) of the three independent experiments. * Indicates significant difference compared to day one within the same group by one-way ANOVA and Tukey’s test. Days that share the same letter show a significant difference (within similar group) (P < 0.05) by one-way ANOVA and Tukey’s test.

