
Figure 2.
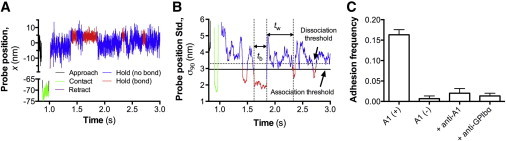
BFP thermal fluctuation assay. (A) In each test cycle, the target bead first approached the probe bead (black), stayed in contact for 0.1 s (green), retracted (purple), and was held in space (blue/red). (B) Plot of sliding standard deviation (Std.) of 90 consecutive points (σ90) of the probe position in (A) versus time t. Horizontal lines represent the threshold values to identify bond association (solid line) and dissociation (dashed line) events. Bond and no-bond states were distinguished in red and blue segments, respectively. (C) Adhesion frequencies between target beads coated with GC and probe beads coated with A1 (A1(+), first column), without A1 (A1(−), second column), with A1 + 50 μg/mL anti-A1 blocking mAb 5D2 (+anti-A1, third column), and with A1 plus 50 μg/mL anti-GPIbα blocking mAb AK2 (+anti-GPIbα, fourth column). Binding frequencies, represented as mean ± SE, were measured from three probe-target pairs per condition and each probe-target pair was tested repeatedly for 100 contact-retract cycles. To see this figure in color, go online.