
Figure 3.
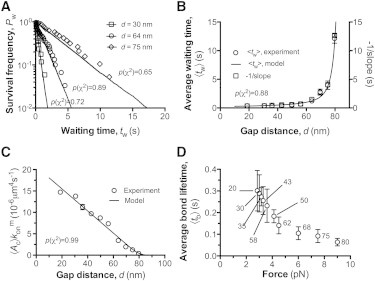
Dependence of 2D association kinetics on the gap distance. (A) The natural log of waiting frequency Pw, calculated as the fraction of measurements with a waiting time >tw, was plotted versus tw for the indicated values of gap distance and fitted by our model. (B) Plots of the average waiting time 〈tw〉 and the negative reciprocal of slope of the linear-fit in (A) versus gap distance d. (C) Apparent 2D on-rate , calculated from the negative slope of the linear-fit in (A), was plotted against the gap distance d. was calculated by dividing the cellular on-rate by the product of the protein densities on the probe (A1) and target (GC) beads, e.g., mrml = 1.95 × 105μm−4 determined by flow cytometry (cf. Materials and Methods). The p-values for model fit to experiment data were indicated accordingly from the χ2 goodness-of-fit tests. (D) Plots of average bond lifetimes 〈tb〉 versus bond force. Gap distances corresponding to forces are indicated. The error bars represent SEM. All the data of experiments (symbols) and models (curves) were obtained at a fixed value of BFP spring constant (κ = 0.25 pN/nm). Each data point was derived from 20∼40 measurements.