
Figure 4.
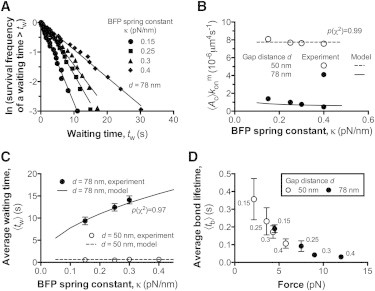
Dependence of 2D association kinetics on the BFP spring constant. (A) The bond waiting time distributions under indicated BFP spring constant κ and matched by our model. (B) Apparent 2D on-rates were plotted versus κ. The adjustment in κ was achieved by varying the aspiration pressure in the micropipette. (C) Plots of the average waiting time 〈tw〉 versus κ. (D) Plots of the average bond lifetimes 〈tb〉 versus force, κ corresponding to each force are indicated. The error bars represent SEM. All the data of experiments (symbols) and models (curves) were obtained at constant gap distances (d = 50, 78 nm).