


Figure 2.
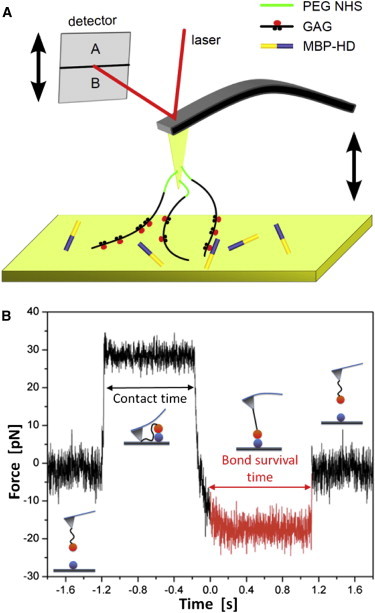
Experimental setup and performance of single molecule force spectroscopy. (a) Typical AFM experimental setup design used to probe interactions between GAG-chains and MBP-HD at the molecular level. The GAG-chains (black lines) were coupled via PEG-NHS ester disulfide linkers (green lines) to a gold-coated cantilever tip. The blue structure represents the MBP-HD fusion protein immobilized on the gold surface (for details about functionalization, see Materials and Methods). (b) Characteristic force clamp data diagram displaying the force by means of the cantilever deflection versus time for a single force clamp experiment. The graph can be divided into four constant force regimes that are illustrated by the pictograms. These represent the force-free cantilever while approaching the surface, the surface dwell time, the constantly loaded HD-GAG-complex (red) and the force-free cantilever after dissociation, respectively. The bond lifetime of an individual complex is given by the constant force regime highlighted in red. To see this figure in color, go online.