
Figure 4.
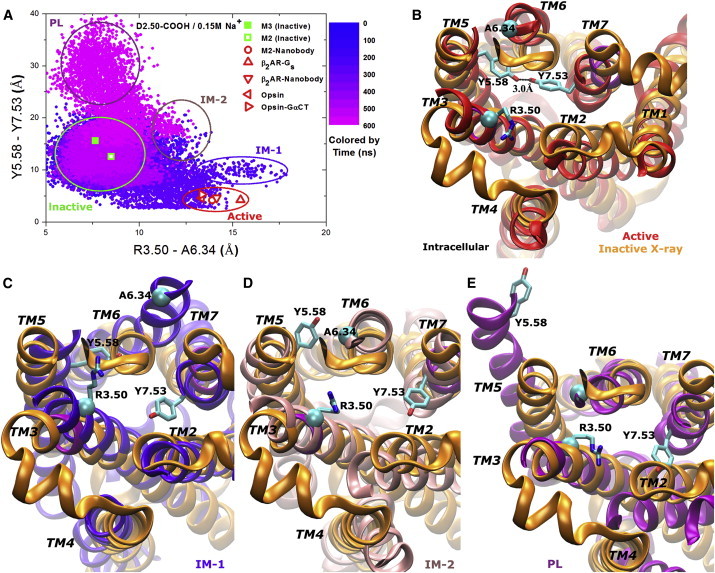
(A) Conformational space sampled by the D2.50-protonated M3 receptor in 0.15 M Na+ solution during a 600 ns aMD simulation. Related GPCR x-ray structures are marked similarly as in Fig. 3A. (B–E) Intracellular view of different conformers of the M3 receptor that might be relevant for GPCR phosphorylation are compared with the x-ray structure (orange): (B) active (red), (C) IM-1 intermediate (blue), (D) IM-2 intermediate (pink), and (E) PL (purple). To see this figure in color, go online.