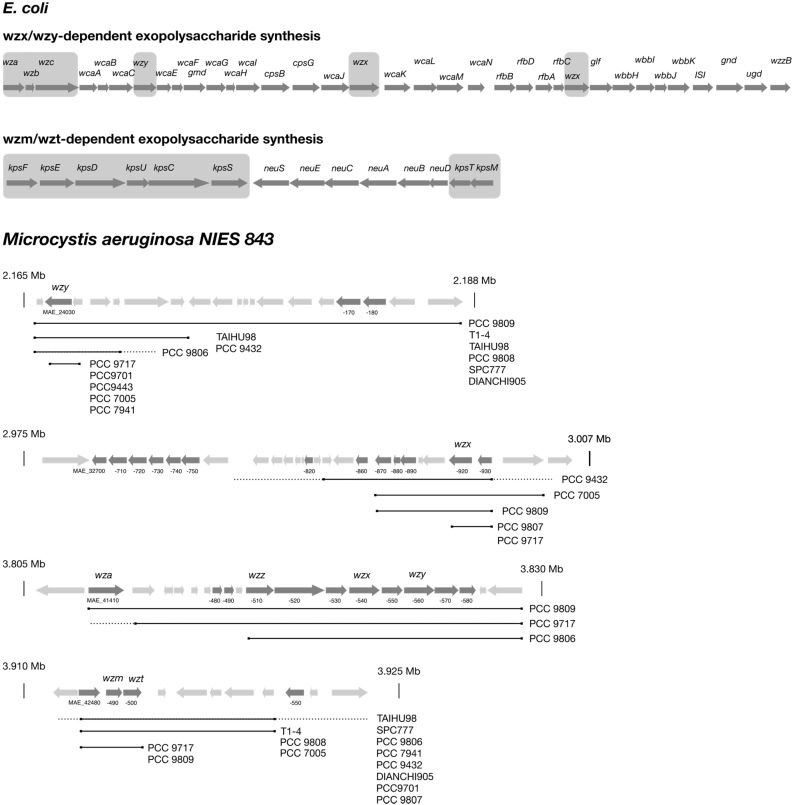
Figure 3.
Genetic organization of EPS gene clusters in E. coli, as well as a representation of the loci harboring homologues of EPS core genes in the complete genome of Microcystis aeruginosa NIES 843 and draft genomes of other Microcystis strains. The typical organization of Group 1 and 4 and Group 2 and 3 capsule biosynthesis clusters is depicted for E. coli (top). Grey boxes highlight the conserved core genes. Genes encoding glycosyltransferases and precursor synthesis vary depending on the serotype. Wzx/Wzy and Wzm/Wzt gene homologues in Microcystis are shown in their genetic background (bottom). Additional genes putatively involved in EPS biosynthesis are shown in dark grey, and genes encoding unrelated functions are shown in light grey. The locus tags of relevant genes are depicted below. Solid black lines indicate similar sequences in Microcystis strains listed on the right end. Dotted lines represent upstream or downstream sequences, which do not show homology to corresponding flanking regions in NIES 843, and no line indicates missing sequence information due to unfinished genome status.

