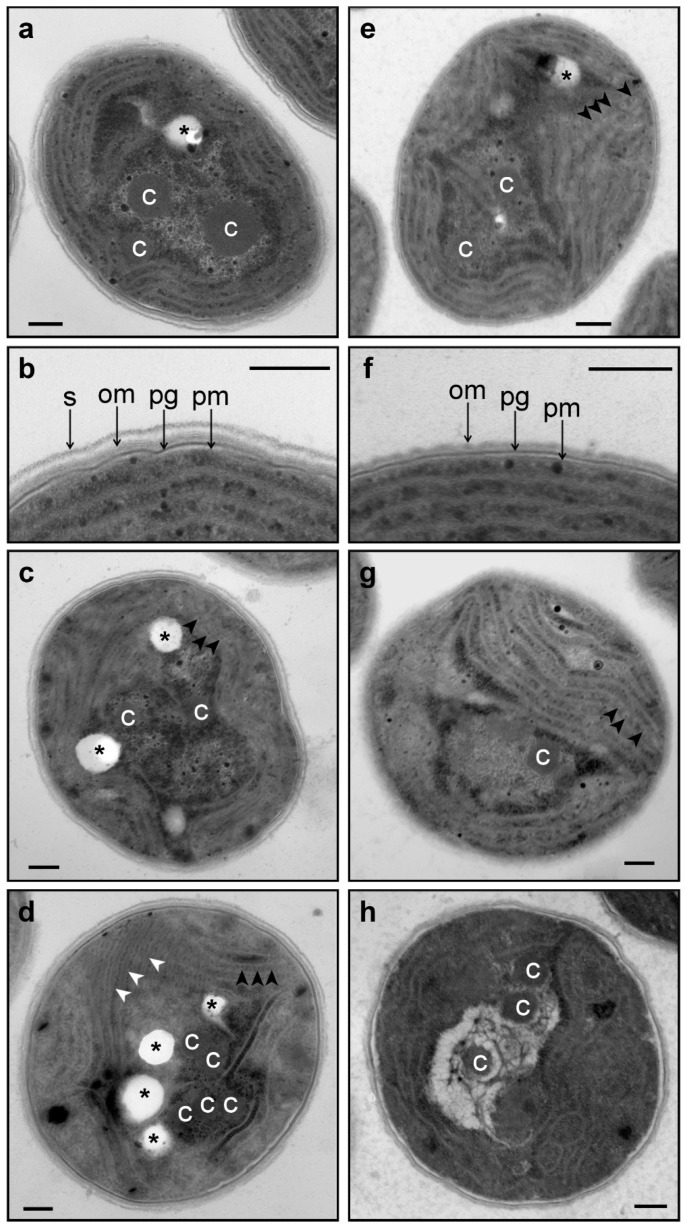
Figure 6.
Ultrastructure of wild-type (a–d) and ΔHik34 mutant (e–h) cells grown under normal conditions (a, b, e, f) and after 2 h (c, g) and 24 h of heat stress (d, h). pm—plasma membrane; pg—peptidoglycan; om—outer membrane; s—s-layer; c—carboxysome; asterisks—electron transparent inclusions; black arrowheads show phycobilisomes; white arrowheads show thickened thylakoids with electron-dense content. All scale bars are 0.2 µm. The typical microscopic photos of cells are shown.

