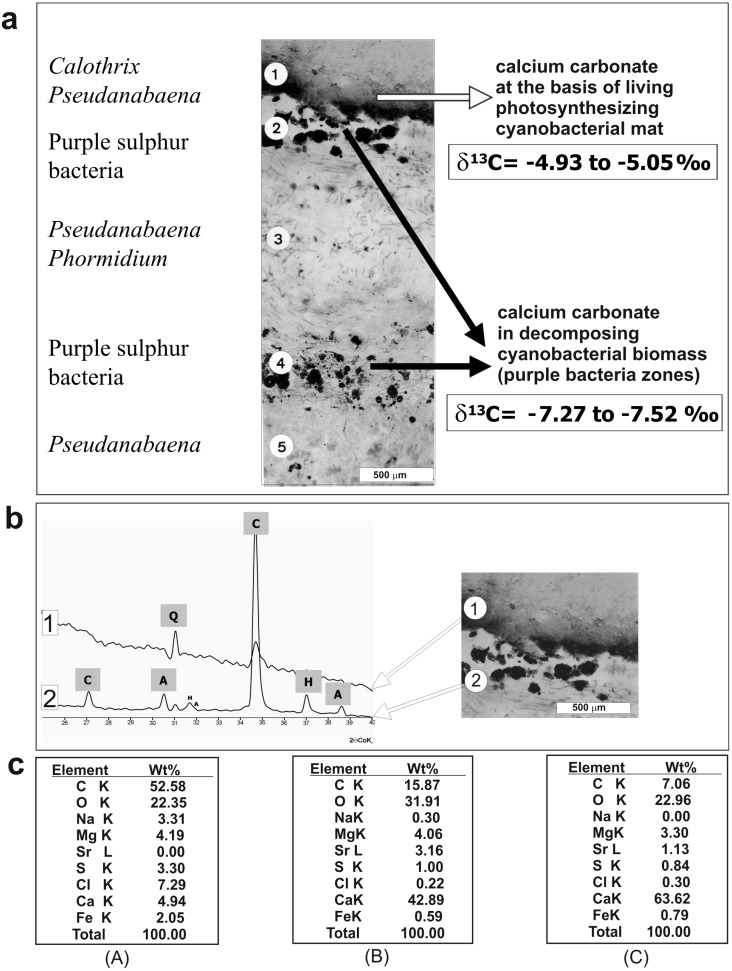
Figure 2.
(a) Vertical cryomicrotome section of a three-year-old mat showing locations of the CaCO3-rich layers (1, 2 and 4) with indicated dominating microbiota and δ13C values. (b) X-ray diffractograms of mineral components from mat from layers l and 2: C—Mg calcite, A—aragonite, H—halite, Q—quartz (sand grains). The numbers of mat zones correspond to those shown in the diagram in Figure 4. (c) SEM-EDS spectra of elemental frequency (wt%) from dried living cyanobacterial biomass from the mat surface layer (A), micrite layer (B), and sparite layer (C).

