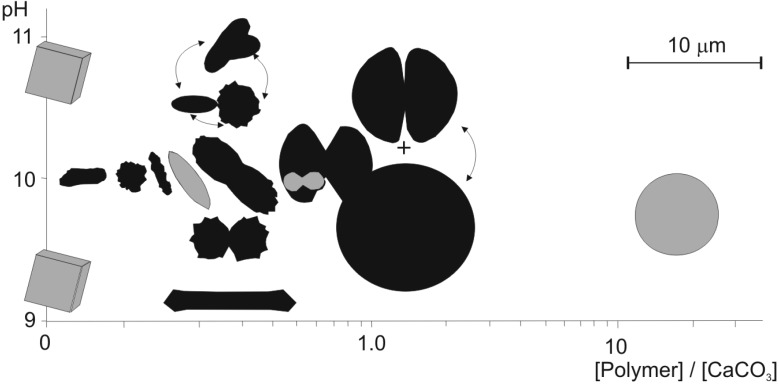
Figure 7.
Diagram showing a variety of CaCO3 morphs precipitated under controlled conditions from a solution of different pH and [polymer]/[CaCO3] ratio for which the unit for both concentrations is g L−1. Arrows indicate morphologies observed simultaneously. Morphs obtained from the same system are drawn in gray and those from other experiments are drawn in black (from [58], slightly modified).

