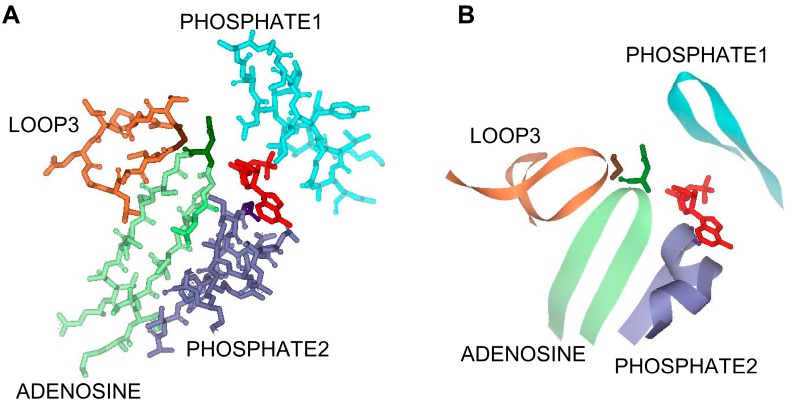
Figure 1.
The active site region of the ATPase domain of MtACK (PDB: IG99) in (A) stick and (B) ribbon diagram. Residues shown conform to those in the alignment in Figure 2. ADP is shown in red, PHOSPHATE1 in light blue, PHOSPHATE2 is in light green with Asn211 in dark green, ADENOSINE is in light purple with Gly331 in dark purple, and LOOP3 is in light orange with Gly 239 shown in brown. For clarity, LOOP4 is not shown.

