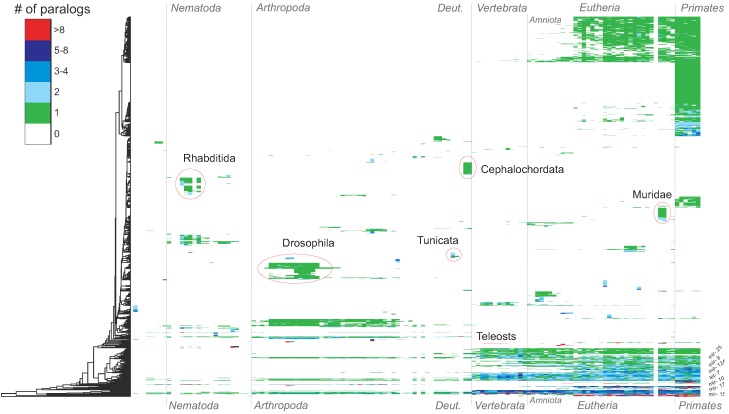
Figure 2.
Map of all miRNA families (y-axis) in all analyzed animal species (x-axis). Each cell (i, j) represents the number of paralogs within miRNA family i in species j. The colors indicate this number. The rows have been clustered by co-occurrence (dendrogram at the left side). Beyond several blocks of lineage-specific miRNA families, e.g., in Rhabditida, Muridae or Cephalochordata, the below described bursts of miRNA innovations are also visible here, e.g., at the origin of vertebrates and Eutheria. The miRNA families in the bottom rows cover nearly the complete range of animal species. Indeed, these families comprise many of the evolutionarily old miRNAs, like mir-10, mir-9 and let-7. Furthermore, few miRNA families have more than eight paralogs.

