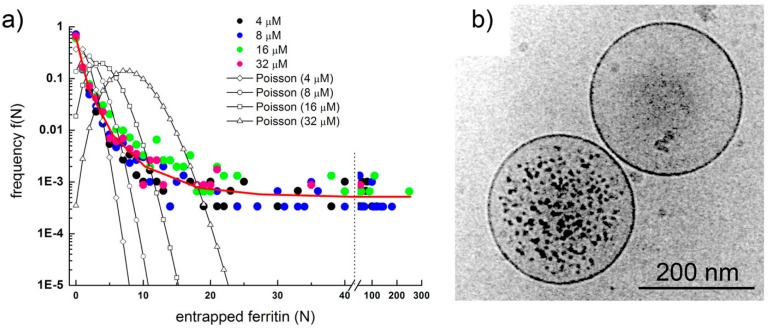
Figure 4.
(a) Ferritin occupancy distribution as determined by analyzing about 7700 individual vesicles imaged by cryo-TEM. Experimental points shown as colored circles, theoretical expectations as empty circles connected by a line; (b) Two conventional POPC vesicles: one is super-filled with ferritin (encapsulating much more ferritin molecules than expected), the other does not contain any ferritin molecule (also against expectations). Images reproduced from [10] with the permission of Wiley.

