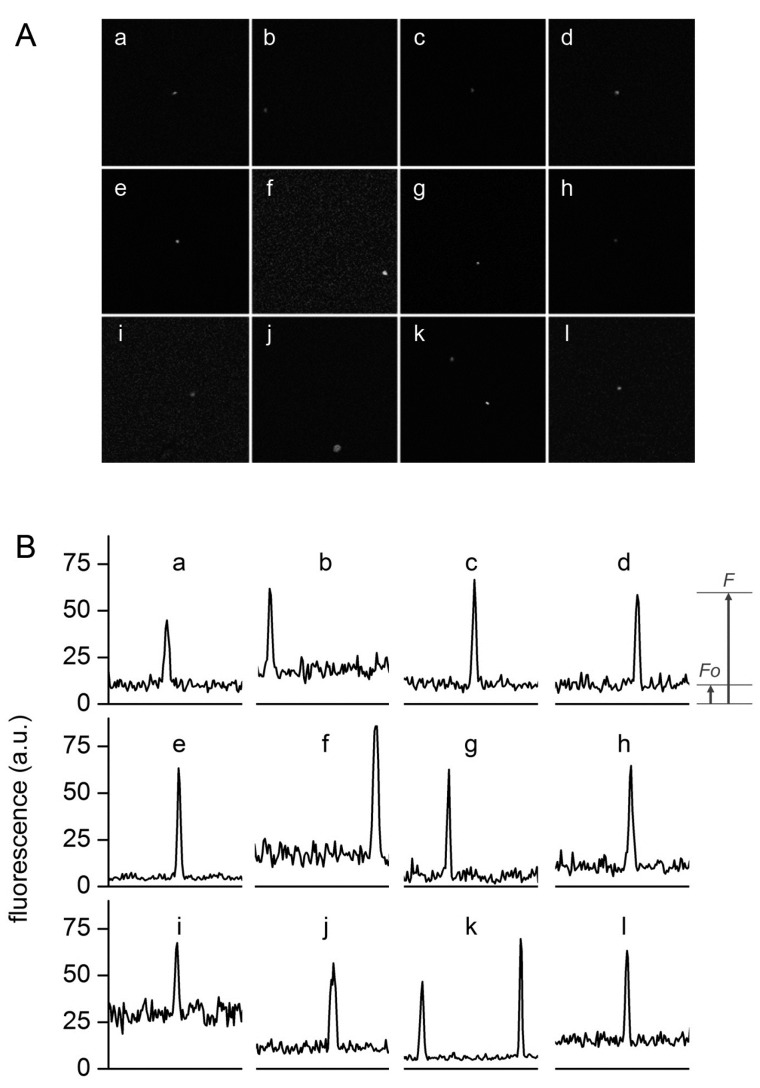
Figure 6.
Typical confocal images (A) and fluorescence profiles; (B) of lipid vesicles whose fluorescence exceeds the fluorescence of the external solution. Solutes: Dextran-FITC (a, b, i), BSA-FITC (c, d, f, g, j, k), dextran-RITC (e), APC (l), PE (h). Methods: M1 (b, e, g, h, i-l), M2 (c, d), M3 (a). The diameters (μm) and the rF values of the vesicles are, respectively: (a) 1.3, 4.3; (b) 1.2, 3.4; (c) 1.8, 6.1, (d) 1.5, 6.4; (e) 1.4, 13; (f) 1.3, 6.1; (g) 1.2, 10.6; (h) 1.3, 6.3; (i) 2.7, 2.3; (j) 1.0, 5.5; (k) 1.5, 7.3 and 1.2, 10.8; (l) 1.4, 4.2.

