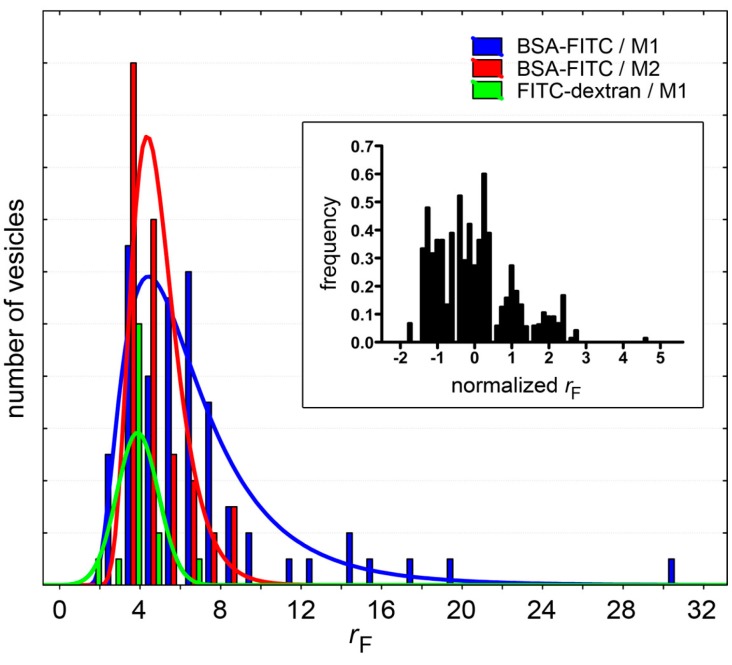
Figure 8.
Fluorescence distributions of solute-containing vesicles (only cases with n > 48 have been shown, see Table 1). Note that whereas for BSA-FITC the distributions can be fitted with a log-normal curve (red and blue sets), FITC-dextran-containing vesicles have an approximately normal rF distribution (green). Inset: To compare different populations (all solutes in Table 1), the distributions of normalized rF values are shown; where rF,normalized = (rF − ˂rF˃)/SD. It should be noted, however, that since these distributions have been built with a small number of events, their interpretation should be done with caution.

