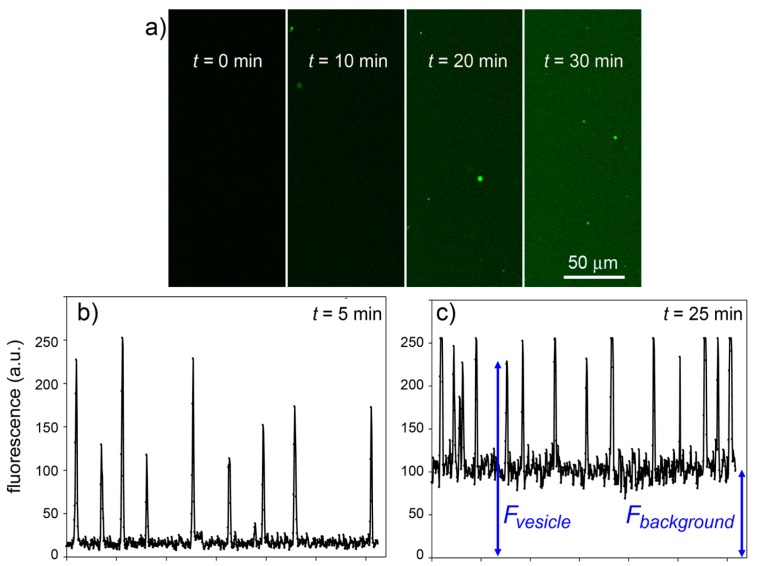
Figure 11.
Experimental results for the CA + CFDA system. (a) Confocal micrographs showing green fluorescent vesicles that appear in the progress of reaction (t = 0, 10, 20, 30 min). The vesicles appear more fluorescent than the background although the same reaction is also occurring outside vesicles. (b,c) The vesicle fluorescence can be estimated by image analysis (by ImageJ software [45])—here shown as the pixel luminosity of samples taken at 5 and 25 min after mixing. Note that the fluorescence values of each vesicle greatly differ from each other (giving a fluorescence distribution, cf. Figure 8) and are well above the background. Note also that the background fluorescence increases with time, as expected.

