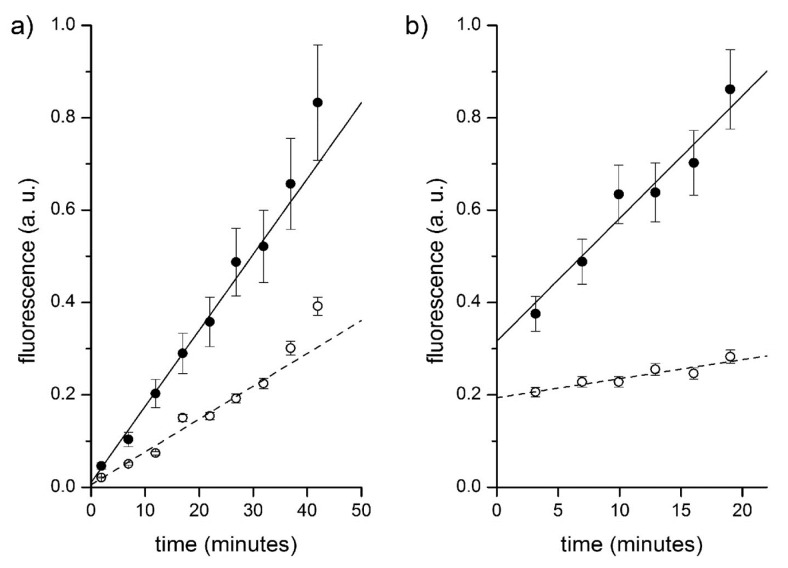
Figure 12.
Fluorescence versus time profiles of enzymatic reactions inside vesicles (filled circles) and in bulk (empty circles). (a) CA-containing vesicles plus externally added CFDA. Data have been fitted by straight lines; the ratio between slopes being 2.3. (b) Proteinase K and BSA-FITC containing vesicles. Data have been fitted by straight lines; the ratio between slopes being 6.5.

