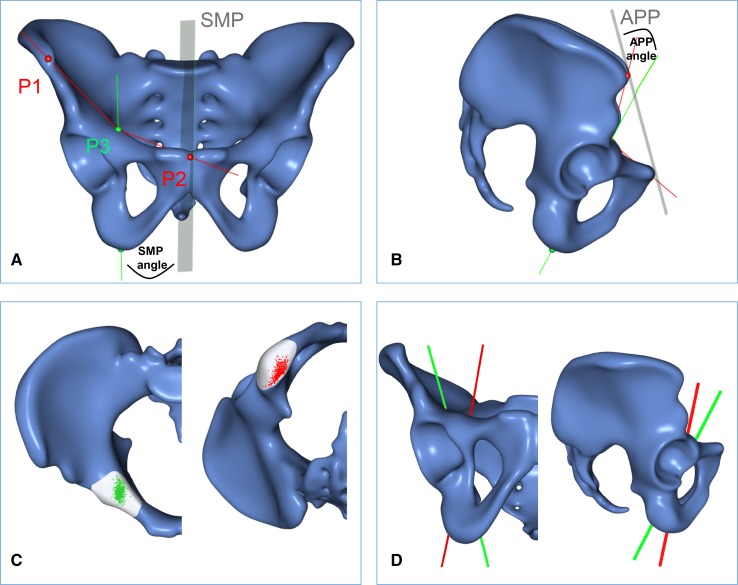
Fig. 1A–D.
The mean shapes of all 523 pelves are shown as templates in (A) front and (B) lateral views. The green line represents the mean corridor axis in relation to the sagittal midline plane (SMP) and the anterior pelvic plane (APP). P1 and P2 represent Distance A (anterosuperior iliac spine to the pubic symphysis). P2 and P3 represent Distance B (pubic symphysis to the screw entry point). The mean ratio of Distance A/B was 1.36 ± 0.16, facilitating determination of the screw entry point for each pelvis based on the intraoperative measurement of Distance A. (C) The cumulative entry (green) and exit (red) points of all 523 optimized osseous corridors are shown. (D) The maximum ranges (green - > red line) of the corridor axes in relation to the sagittal midline plane and the anterior pelvic plane are shown.

