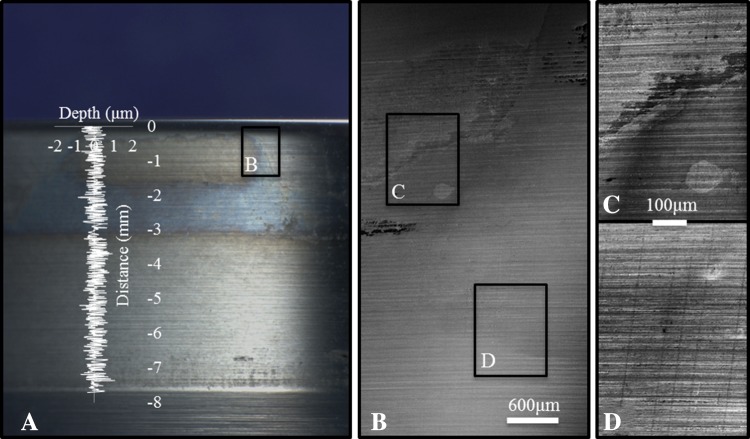
Fig. 7A–D.
Visual indications of liner damage, which was shown to have quantifiable material loss, can be seen. (A) A visual overview of the taper surface is shown. (B) Scanning electron microscopy, 10 kV, shows topographic changes at low magnification (×25). (C) Machine marks from manufacturing can be clearly seen (×100). (D) There is a distinct change in surface topography in a damaged region (×100). The axial profile (overlay) shows quantitative surface topography along the taper. The fit region was −3.3 to −1.3 mm on the distance axis.

