. 2015 Mar 6;4:e05413. doi: 10.7554/eLife.05413

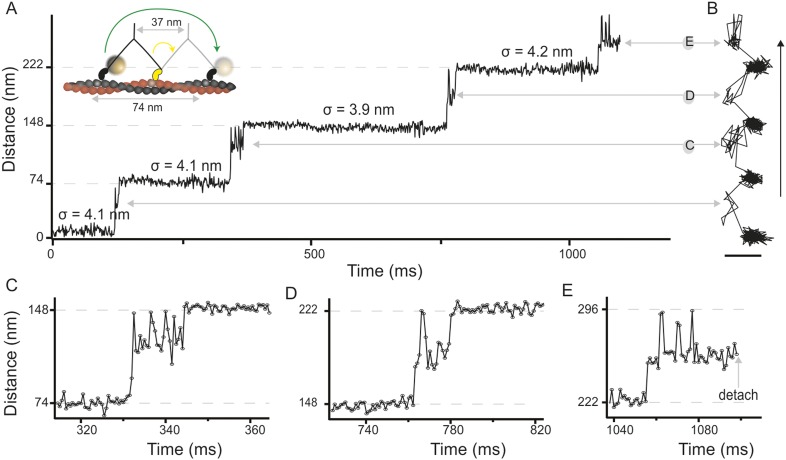
Figure 1. High-speed nanometric tracking of myosin 5 with interferometric scattering (iSCAT) microscopy.

(A) Distance traveled as a function of time for a single myosin 5 molecule biotinylated at the N-terminus and labeled with a 20 nm streptavidin-functionalized gold particle. The lateral localisation precision, σ, defined as the standard deviation of the positional fluctuations of the label while bound to actin is given above each of the actin-attached periods. Inset: schematic of gold-labeled myosin 5 stepping along actin. (B) Corresponding 2D-trajectory with the arrow indicating the direction of movement. (CE) Close-up of the transient states indicated in A and B. ATP concentration: 10 μM. Scale bar: 50 nm. Imaging speed: 1000 frames/s (corresponding video: Video 1).

DOI: http://dx.doi.org/10.7554/eLife.05413.003

Figure 1.

Figure 1—figure supplement 1. Activity of myosin 5 labeled with 20 nm gold nanoparticles at the N-terminus.

Figure 1—figure supplement 1.

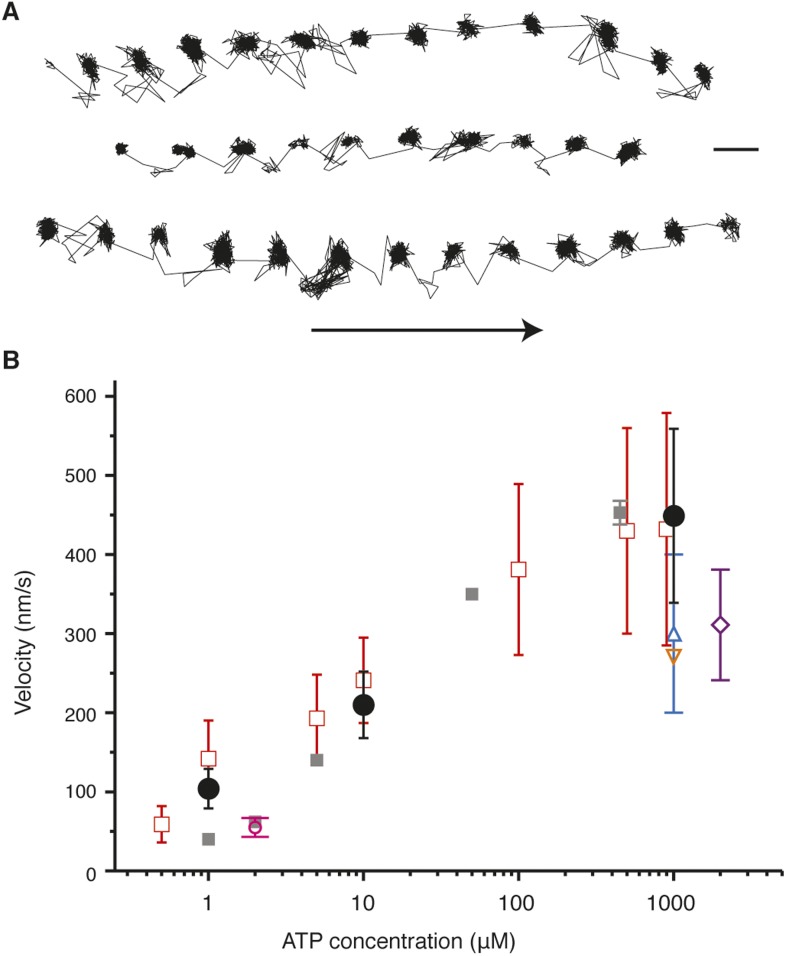
(A) Sample trajectories at [ATP] = 10 µM and at 1000 frames/s. Arrow indicates direction of motion. Scale bar: 50 nm. (B) Comparison of myosin 5 activity recorded in this work with previous single molecule studies. Black circles: this study. Symbols are defined as: purple rectangle, (Mehta et al., 1999) grey squares, (Forkey et al., 2003) dark blue square, (Warshaw et al., 2005) orange triangle, (Komori et al., 2007) pink circle, (Ohmachi et al., 2012) red open squares, (Ortega Arroyo et al., 2014).
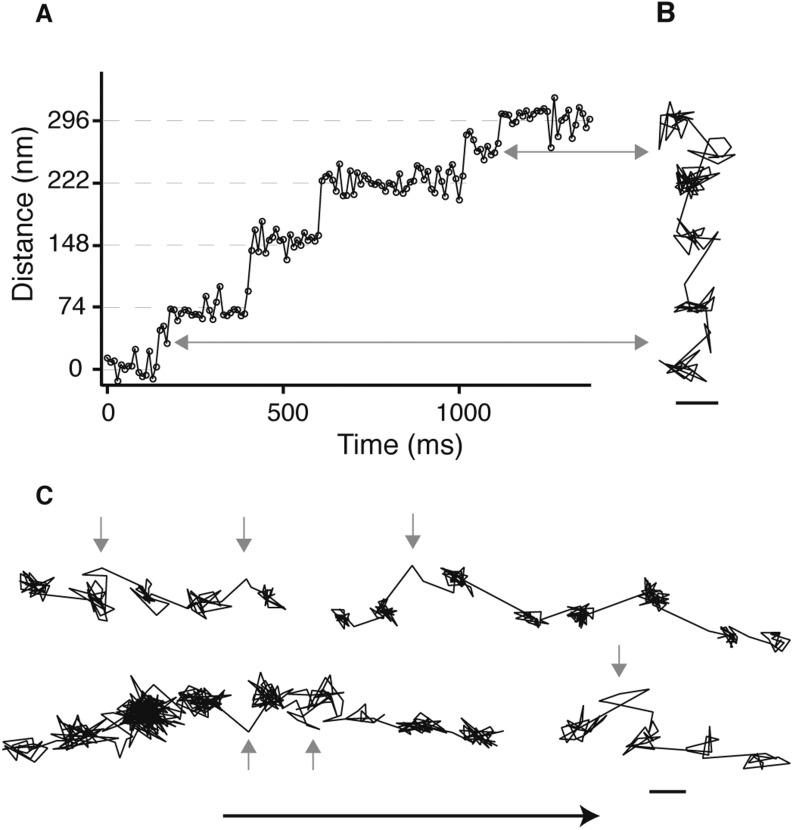
Figure 1—figure supplement 2. Detection of the transient state with a molecular sized fluorescent label.

Figure 1—figure supplement 2.

(A) Representative distance time series of a myosin 5 molecule labelled with an atto-647N/streptavidin conjugate at the N-terminus and tracked using single molecule total internal fluorescence microscopy. (B) Corresponding 2D trajectory. (C) Additional traces exhibiting the transient state marked by arrows. ATP concentration: 10 μM. Scale bar: 50 nm. Imaging speed: 100 frames/s.
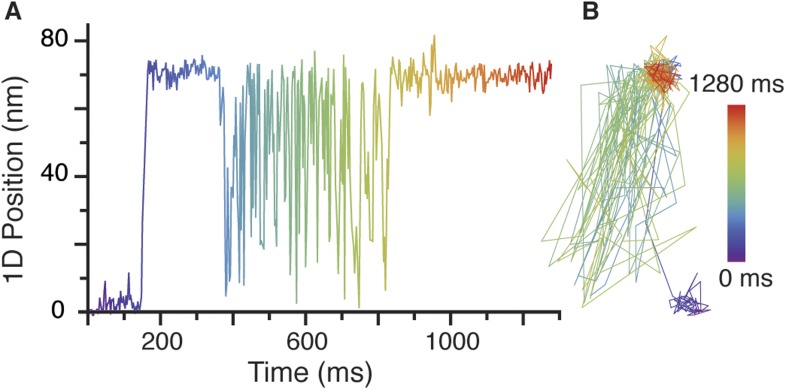
Figure 1—figure supplement 3. Rare transient unbinding events for the leading head of myosin 5.

Figure 1—figure supplement 3.

(A) Representative time trace segment of an event in which the leading head detaches from the actin filament and exhibits the intermediate state behaviour reported in the main text. (B) Corresponding 2D—trajectory of the segment highlighted in A. ATP concentration: 1 μM. Scale bar: 50 nm. Imaging speed: 1000 frames/s.