. 2015 Mar 6;4:e05413. doi: 10.7554/eLife.05413

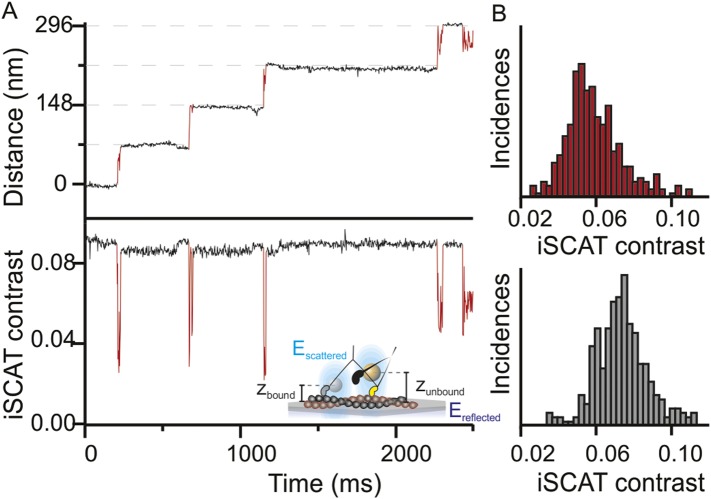
Figure 2. Three-dimensional interferometric tracking of the myosin head.

(A) Distance trace (upper panel) with the simultaneously recorded iSCAT contrast (lower panel). The red subset of the traces corresponds to the unbound head state. Inset: schematic illustrating how the difference in optical path difference for the bound (zbound) and unbound (zunbound) state leads to changes in iSCAT contrast caused by the interference of the reflected (Ereflected) and scattered (Escattered) electric fields. (B) Normalized histogram of the average iSCAT contrast while the head is in the transient state (red, N = 329) or bound to actin (black, N = 303). ATP concentration: 10 μM. Imaging speed: 1000 frames/s.

DOI: http://dx.doi.org/10.7554/eLife.05413.008

Figure 2.

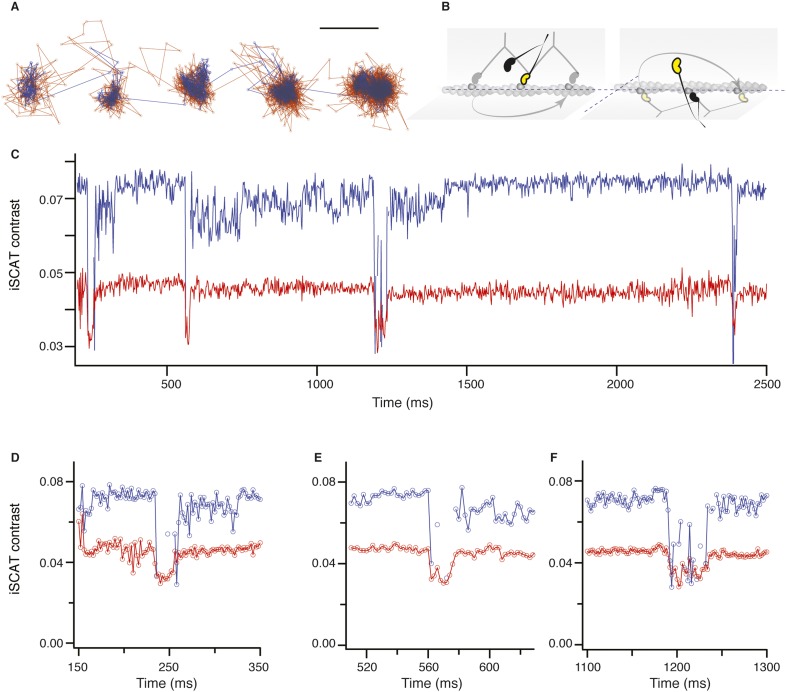
Figure 2—figure supplement 1. Dual colour iSCAT imaging of myosin 5.

Figure 2—figure supplement 1.

(A) 2D-trajectory of myosin 5 stepping along actin recorded simultaneously with 445 nm (blue trace) and 635 nm (red trace) illumination. Although the latter channel exhibits higher noise due to a lower scattering signal, the transient state is evident in every step even though much of the data are lost in the trace recorded at 445 nm due to the major drop in scattering intensity. (B) Schematic of myosin stepping along actin with different azimuthal orientations relative to the actin filament. (C) Corresponding iSCAT contrast as a function of time. Although the contrast is large in the blue channel, it drops much more significantly during population of the transient state. (DF) Zoom of the contrast behaviour during the transient state from (C). ATP concentration: 10 μM. Scale bar: 50 nm. Imaging speed: 1000 frames/s.