. 2015 Mar 6;4:e05413. doi: 10.7554/eLife.05413

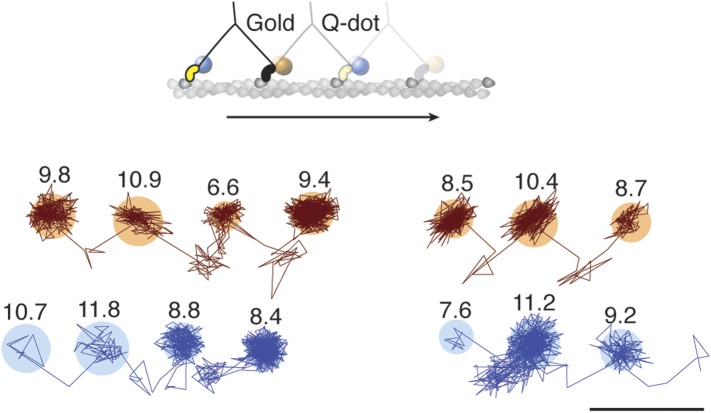
Figure 3. Simultaneous scattering and fluorescence tracking of a single myosin 5a.

One head was labeled with a 20 nm streptavidin-functionalized gold particle (red) and the other with a fluorescent quantum dot (blue). Reported values correspond to the standard deviation σ in the position of the bound state (nm) and the shaded regions encompass an area of 3σ. The traces are colored according to the label colors in the inset. ATP concentration: 10 μM. Scale bar: 100 nm. Imaging speed: 500 frames/s.

DOI: http://dx.doi.org/10.7554/eLife.05413.010

Figure 3.

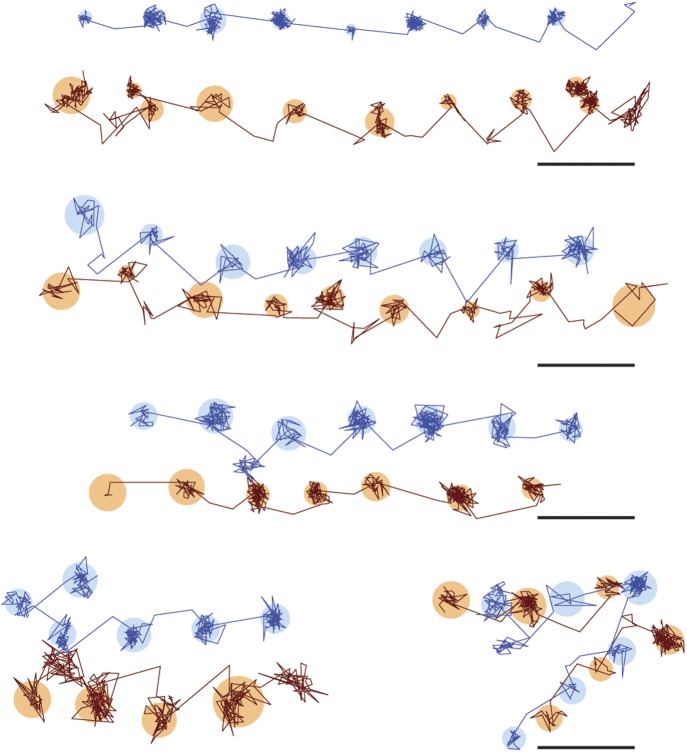
Figure 3—figure supplement 1. Additional traces of simultaneous scattering and fluorescence tracking of a single myosin 5a.

Figure 3—figure supplement 1.

One head was labelled with a 20 nm streptavidin-functionalized gold particle (red) and the other with a fluorescent quantum dot (blue). Reported values correspond to the standard deviation σ in the position of the bound state (nm) and the shaded regions encompass an area of 3σ. The traces are colored according to the label colors in the inset. ATP concentration: 10 μM. Scale bar: 100 nm. Imaging speed: 100 frames/s.