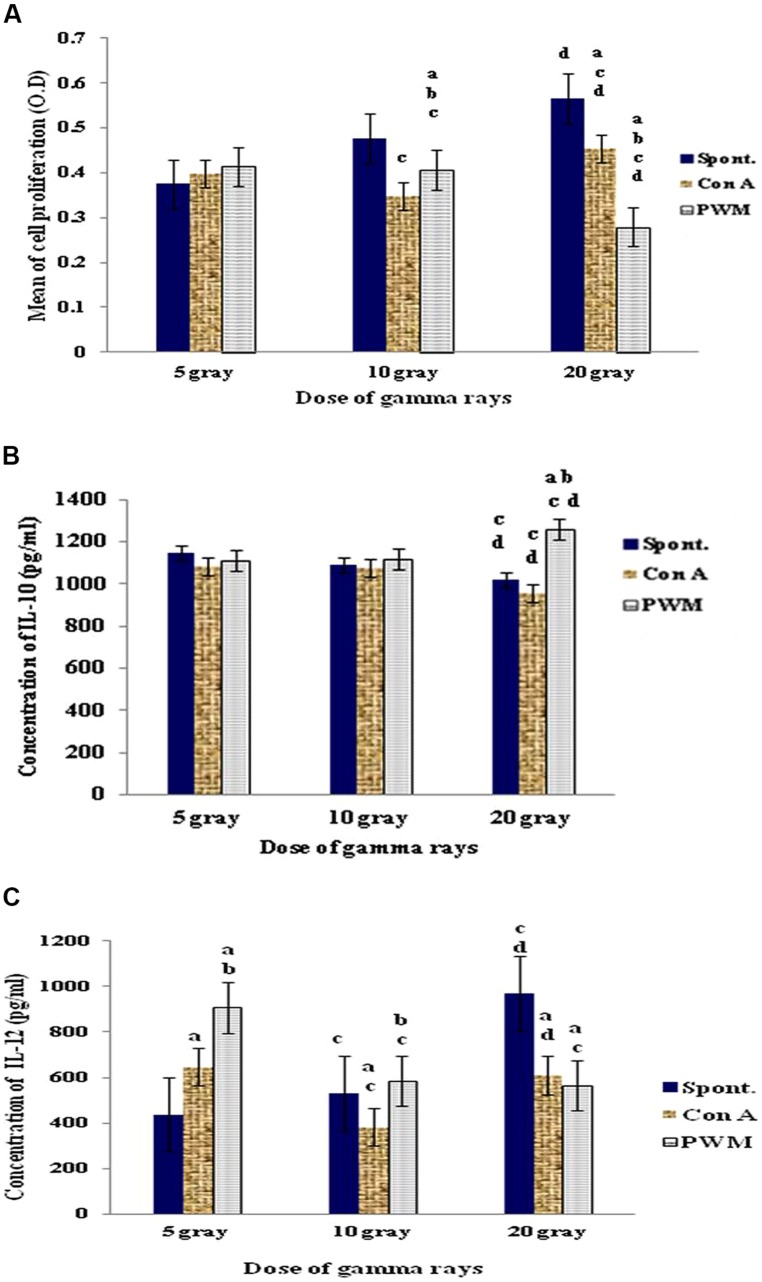
FIGURE 1.
Diagrammatic representation for comparison between (A) cell proliferation (O.D.), (B) IL-10 (pg/ml), and (C) IL-12 (pg/ml) release either spontaneously or with in vitro stimulation with Con A or PWM after irradiation of intact spleens. aLevel of significance between spontaneously and in vitro mitogen induced data, blevel of significance between Con A and PWM-induced data, clevel of significance between data of 5 Gy versus 10 and 20 Gy, dlevel of significance between data of 10 and 20 Gy.

