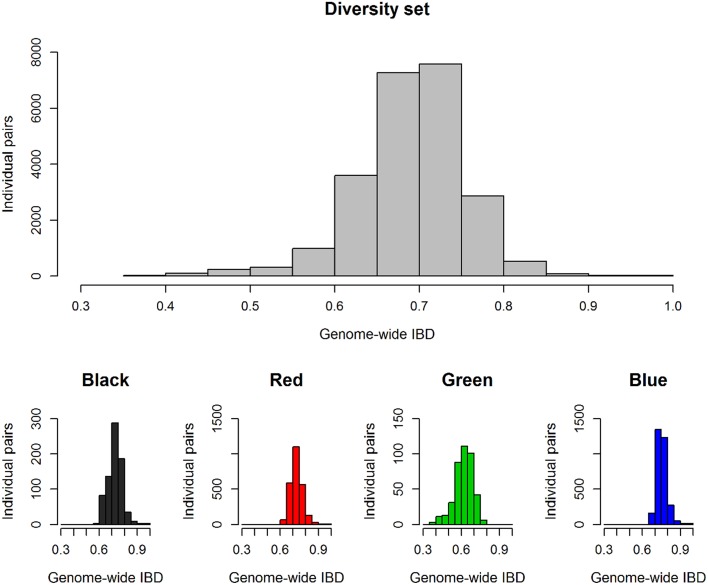
Figure 2.
Genetic relationship between all individual pairs within the total diversity set (n = 218) and within the single clusters from k-means clustering. Histograms show the frequency of individual pairs depending on their kinship coefficients IBD (identity by descent) which score allelic identity by descent.

