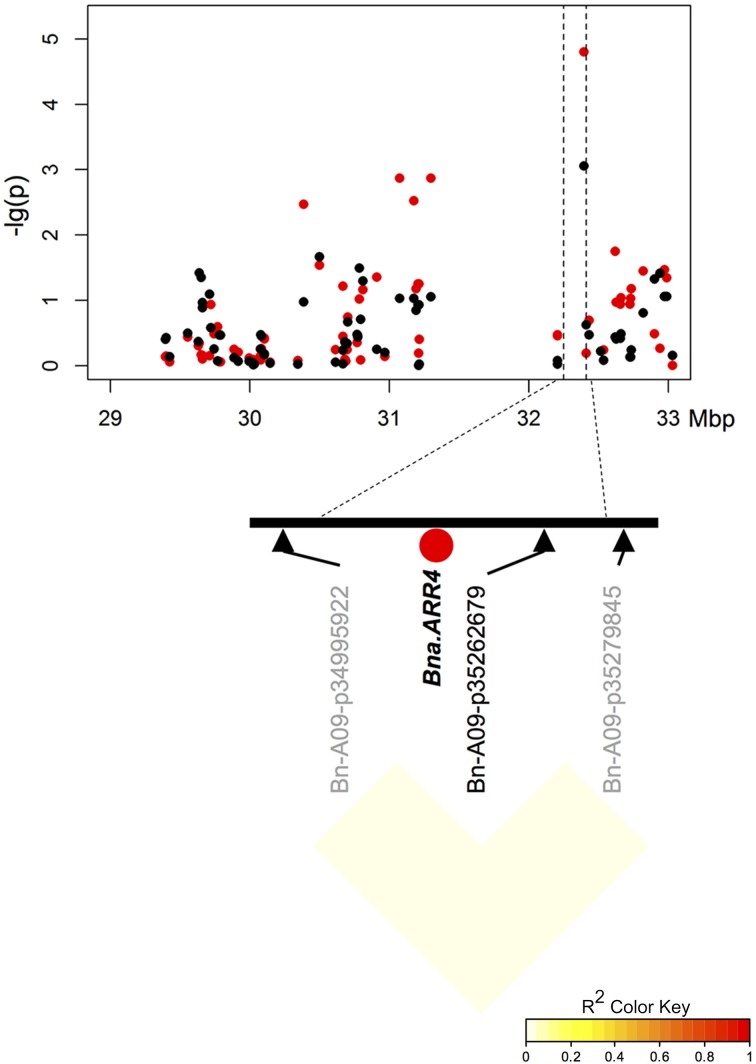
Figure 4.
Manhattan plot describing marker-trait associations for the trait ES within the chromosomal region around candidate BnaA09g48160D (Bna.ARR4) on chromosome A9, and correlations between surrounding markers. Red dots represent associations calculated for SL2011. Black dots represent associations for SL2012.

