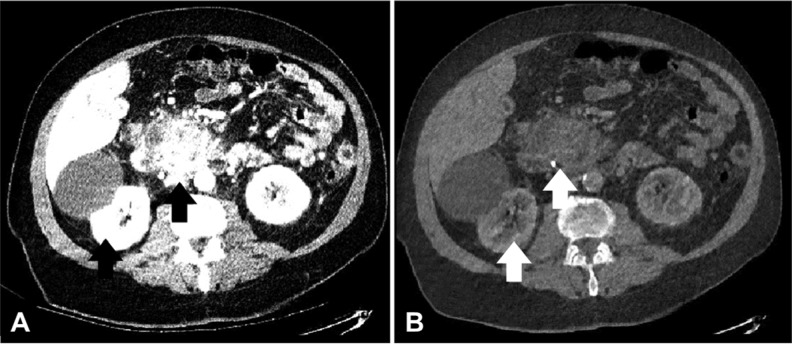
Fig. 4.
Pancreatic adenocarcinoma on DECT at different simulated keV levels. Same pancreatic tumor as in Fig. 2 at (a) 40 keV and (b) 140 keV. Note that, at the lower energy, the iodine attenuation is enhanced (arrows). At the higher energy, the water attenuation is dominant, appearing like a precontrast image

