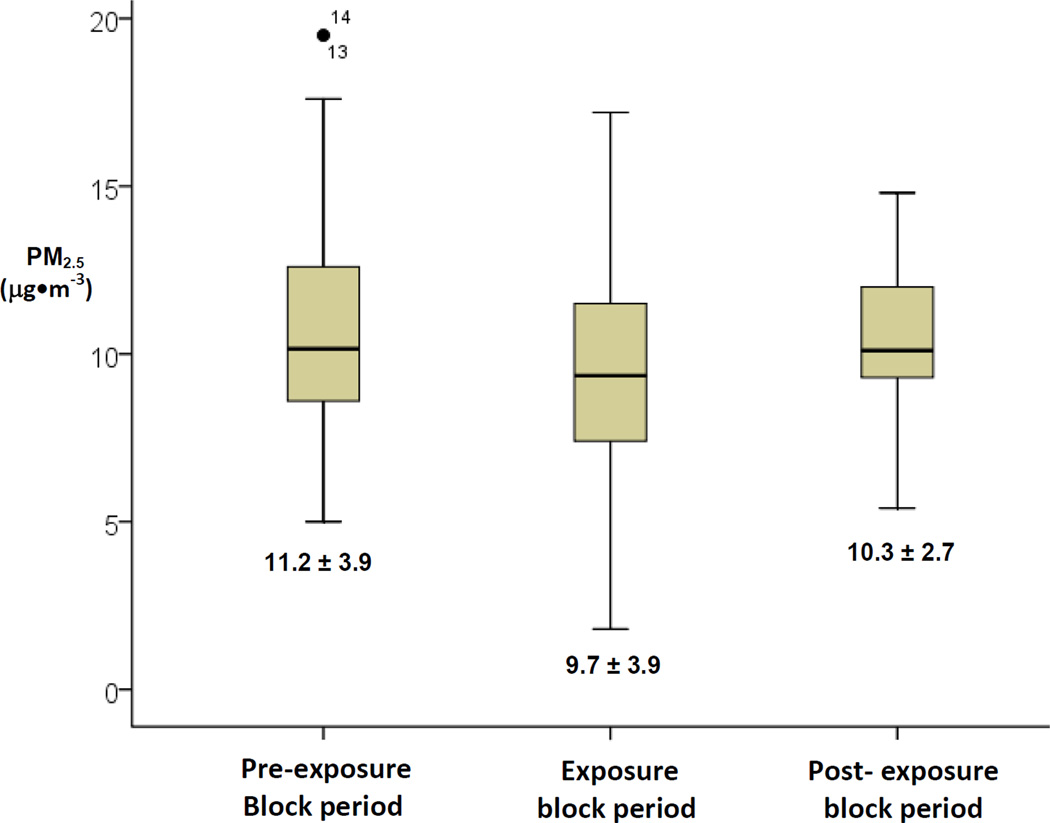
Figure 2. Time-averaged fine particulate matter levels during 5-day periods prior to each outcome measurement.
Box and whiskers represent the inter-quartile ranges and 2 standard deviations of PM2.5 (µg•m−3), respectively
Lines in the box are medians and text data in the figure are the means and standard deviations Individual points represent outliers with individual patient numerical identifier

