
Figure 4.
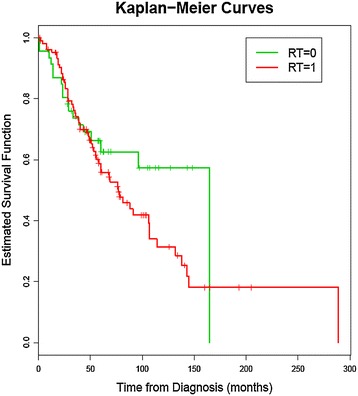
Kaplan-Meier Curves; RT = 0, for patients not treated by radiotherapy and RT = 1, for patients treated with radiotherapy, p = 0.233.
Official websites use .gov
A
.gov website belongs to an official
government organization in the United States.
Secure .gov websites use HTTPS
A lock (
) or https:// means you've safely
connected to the .gov website. Share sensitive
information only on official, secure websites.
Kaplan-Meier Curves; RT = 0, for patients not treated by radiotherapy and RT = 1, for patients treated with radiotherapy, p = 0.233.