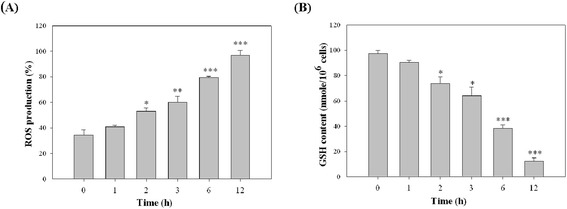
Figure 6.

The effect of apigenin on the intracellular levels of ROS and GSH in T-24 cells. Cells were treated with 30 μg/ml apigenin for various periods (0, 1, 2, 3, 6, and 12 h), and then were analysed for (A) the intracellular ROS production (B) the intracellular GSH content by spectrofluorophotometer as described in “Materials and Methods” section. The results represented the average of three independent experiments ± S.D. *P < 0.05, **P < 0.01, ***P < 0.001 compared with the 0 h-treated time.
