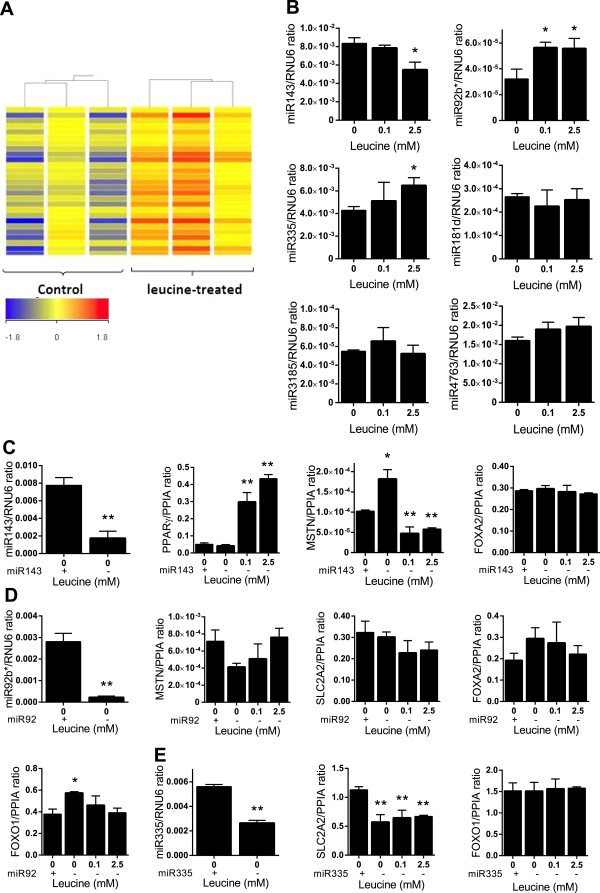
Figure 5.

Discovery and validation of miRNA expression after leucine supplementation. (A) Cluster analysis of miRNAs available on Affymetrix miRNA chips. The red color shows relatively abundant expression of the same miRNA when compared to controls, whereas the blue color indicates a low expression relative to other samples. Cluster analysis was performed with Gene Spring GX. (B) Validation of specific miRNA species exhibiting significant difference from the control group, using real-time PCR (qPCR). Finally, differential expression of specific target genes measured after inhibition of miR-143 (C), miR-92b*(D) and miR-335 (E) using selective siRNAs. Values are presented as the mean ± SEM. Statistical significance relative to untreated control, *P <0.05, **P <0.01 (n =3).
