Figure 4.

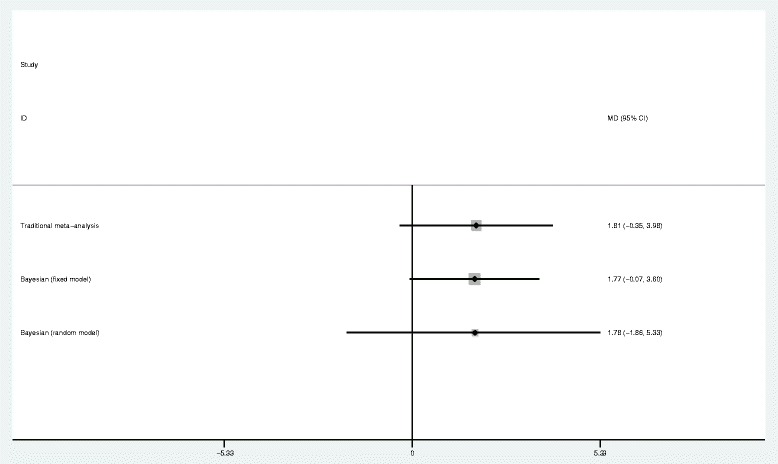
Forest plot of pooled risk ratio for the effect on renal function (Bayesian analysis with fixed and random effects models developed by Dias [9]). CI, confidence interval; Cr, creatinine; HES, hydroxyethyl starch.

Forest plot of pooled risk ratio for the effect on renal function (Bayesian analysis with fixed and random effects models developed by Dias [9]). CI, confidence interval; Cr, creatinine; HES, hydroxyethyl starch.