Figure 6.

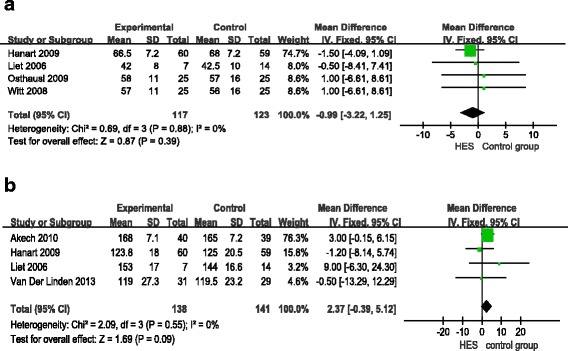
Forest plots of pooled estimates for the effect on hemodynamics. a) mean arterial pressure (MAP). b) heart rate (HR). CI, confidence interval; HES, hydroxyethyl starch; IV, inverse variance.

Forest plots of pooled estimates for the effect on hemodynamics. a) mean arterial pressure (MAP). b) heart rate (HR). CI, confidence interval; HES, hydroxyethyl starch; IV, inverse variance.