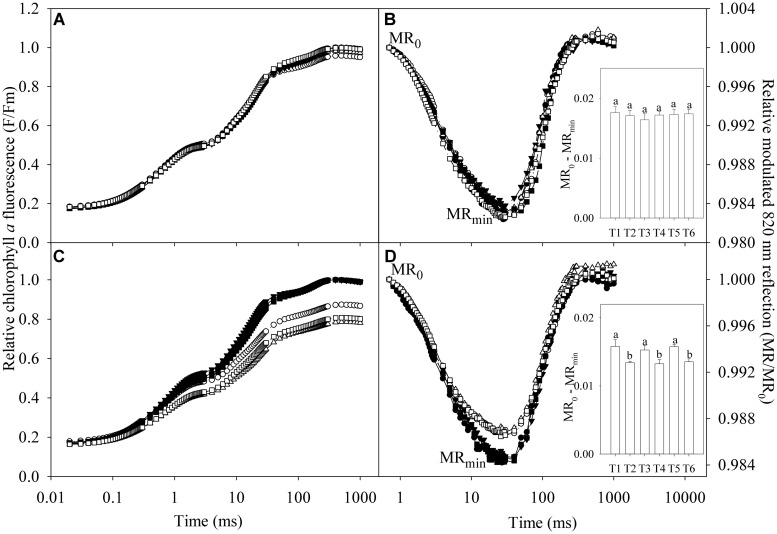
FIGURE 3.
Relative chlorophyll a fluorescence (F/Fm) and relative modulated 820 nm reflection (MR/MR0) during the first 1 s red illumination in the leaves of tetraploid (A,B) and diploid (C,D) honeysuckle exposed to 0 (closed symbols) and 300 mM (open symbols) NaCl at day 7 (circles), 11 (triangles), and 15 (squares). F is chlorophyll a fluorescence intensity during the 1 s of red illumination and Fm is the maximal fluorescence intensity. MR0 is the value at the onset of actinic illumination (at 0.7 ms) and MR is the reflection signal during the 1 s of red illumination. MRmin is the minimal value of MR/MR0 at about 29 ms. T1, T2, T3, T4, T5, and T6, respectively, indicate the treatments with 0 and 300 mM NaCl for 7, 11, and 15 days. Data in the figure indicate the mean of five replicates. Different letters on error bars indicate significant difference at P < 0.05.

