
Figure 3.
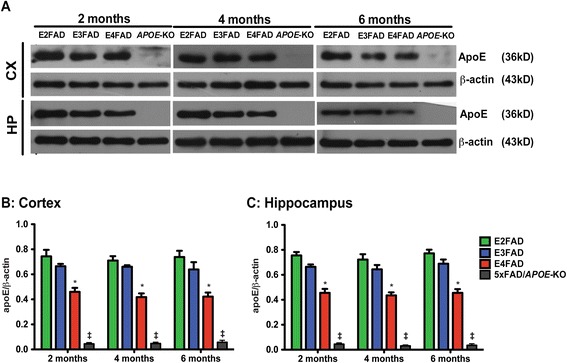
ApoE levels are lower in E4FAD mice compared to E3FAD and E2FAD mice. Results at 2-, 4-, and 6-months of age for E2FAD, E3FAD, E4FAD, and 5×FAD/APOE-KO mice: (A) Representative Western blot for apoE protein in cortex (CX) and hippocampus (HP) with β-actin as a control for protein loading (APOE-KO = 5×FAD/APOE-KO). Relative apoE protein levels in (B) CX and (C) HP. N = 6 per group, expressed as means ± S.E.M. Significant difference at p < 0.05 via two-way ANOVA, Bonferroni post-hoc test identified by *for E4FAD compared to E2FAD and E3FAD. No significant change between time points. ‡ApoE levels in 5xFAD/APOE-KO mice were ≥ 10-fold lower than E4FAD, p < 0.000001.