
Figure 5.
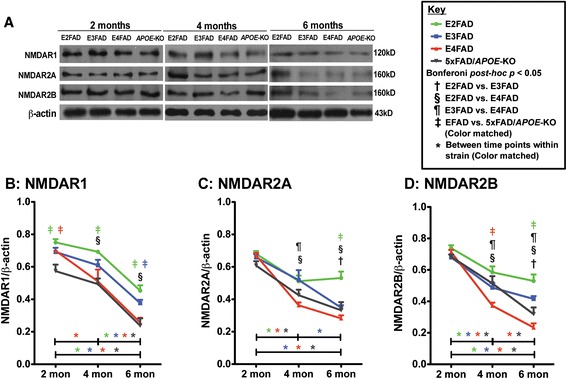
Age-dependent decline in NMDAR subunit protein levels are exacerbated in E4FAD and 5xFAD/ APOE -KO compared to E3FAD and E2FAD mice. Results at 2-, 4-, and 6-months of age for E2FAD, E3FAD, E4FAD, and 5xFAD/APOE-KO mice: (A) Representative Western blot for NMDAR1, NMDAR2A and NMDAR2B proteins in HP with β-actin as a control for protein loading (APOE-KO = 5xFAD/APOE-KO). Relative protein levels of (B) NMDAR1, (C) NMDAR2A, and (D) NMDAR2B. N = 6 per group, expressed as means ± S.E.M. Significant differences at p < 0.05 via two-way ANOVA, Bonferroni post-hoc test identified by: †between E2FAD and E3FAD, § between E2FAD and E4FAD, ¶between E3FAD and E4FAD. Color matched ‡(green = E2FAD, blue = E3FAD, red = E4FAD, grey = 5xFAD/APOE-KO) between EFAD strain and 5xFAD/APOE-KO. Along the x-axis, color matched *indicates significant differences between time points within a mouse strain. There is no significant change with age unless marked.