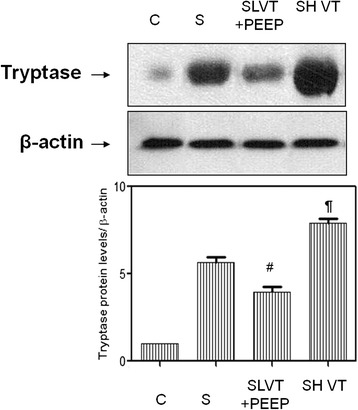
Figure 3.

Western blot analysis of tryptase. The upper panel is a representative gel for each experimental group. The lower panel represents the relative optical density of tryptase normalized against β-actin. C: non-septic, anesthetized, non-ventilated, spontaneous breathing; S: septic, anesthetized, non-ventilated, spontaneous breathing; SLVT + PEEP: septic, ventilated with low tidal volume plus positive end-expiratory pressure (PEEP) of 10 cmH2O; SHVT: septic, ventilated with high tidal volume. Six animals were quantified in each group. # P < 0.01 vs. S; ¶ P <0.001 vs. S.
