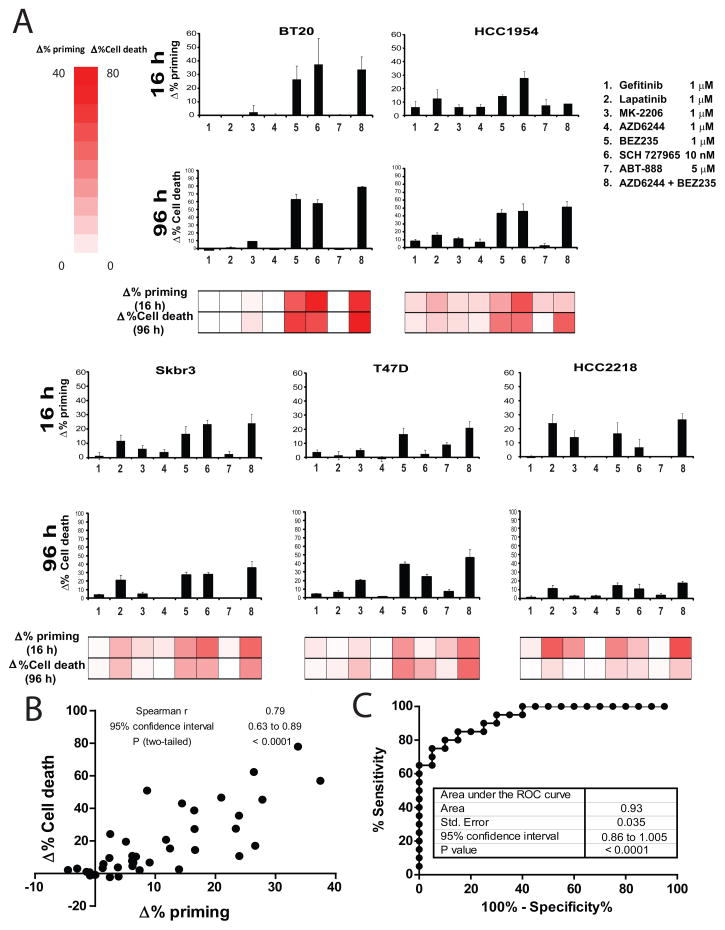
Figure 2. DBP predicts chemotherapy sensitivity in breast cancer cell lines.
(A) DBP was performed in five breast cancer cell lines: BT20, HCC1954, SKBR3, T47D and HCC2218 showing different pattern of response to the treatments tested (16 hour incubation): 1) gefitinib 1μM, 2) lapatinib 1μM, 3) MK-2206 1μM, 4) AZD6244 1μM, 5) BEZ235 1μM, 6) dinaciclib 10 nM (SCH 727965), 7) ABT-888 5μM and the combination 8) AZD6244 + BEZ235. Results expressed as Δ% priming (increase in priming compared to non-treated cells). Values indicate mean values ± SEM, at least three independent experiments were performed (N≥3). Cell death measurements at 72 hours for the same cell lines under the same treatments by FACS using Annexin V/PI staining. Results are expressed as increase on cell death or Δ%Cell Death, compared to non-treated cells. Values indicate mean values ± SEM, at least three independent experiments were performed (N≥3). (B) Plot showing the significant correlation between Δ% priming at 16h and Δ%Cell Death at 72h. (C) Receiver Operating Characteristic (ROC) curve analysis.

