Figure 6.
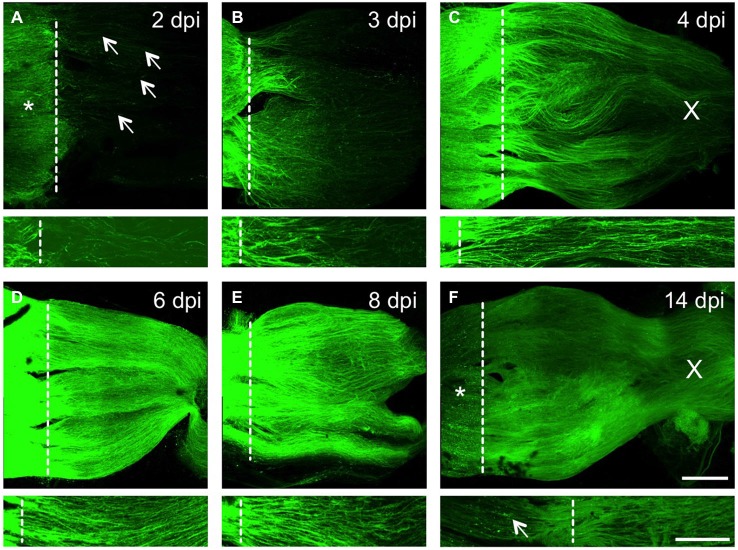
Time course of axonal regeneration in the injured optic nerve. (A–F) Maximum intensity projections of confocal scans of cleared, naive wholemount optic nerves of GAP-43:GFP zebrafish at 2, 3, 4, 6, 8 and 14 days post injury (dpi), respectively. The lesion site is indicated with a dashed line, proximal is to the left. Scale bar = 200 µm. Lower pictures depict higher magnifications from one Z-section of the respective optic nerves. In (A–C), these close ups were increased in brightness and contrast to visualize single axons. Scale bar = 100 µm. (A) Injured RGC axons strongly express GFP proximal to the lesion site (asterisk) already at 2 dpi. Some axons have started to regrow into the optic nerve (arrows). (B) Significantly more axons are regenerating at 3 dpi, with the majority reaching half-distance towards the optic chiasm. (C) Even more RGC axons are regenerating in the optic nerve at 4 dpi, with axons already passing through the optic chiasm (X). (D) The optic nerve is filled with regenerating RGC axons at 6 dpi, leading to further increased GFP expression. (E) Strong axonal GFP expression is still detected at 8 dpi. (F) GFP expression is reduced proximal of the lesion site (star) and appears punctuated (arrow) at 14 dpi. The distal part of the regenerating axons, however, is still strongly labeled and individual axons can be identified.

