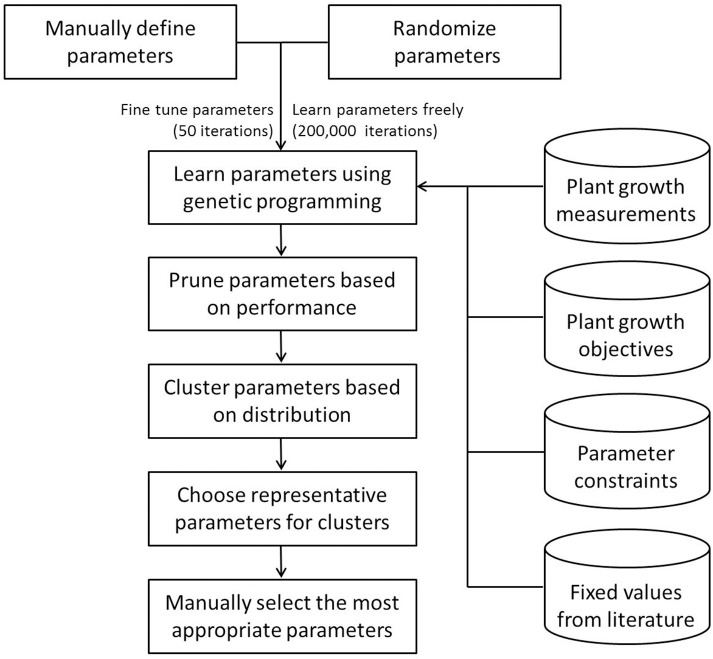
Figure 2.
Workflow of the parameterization process of the Arabidopsis Leaf Area Growth Model. This schematic diagram illustrates key steps followed during parameterization of the Arabidopsis Leaf Area Growth Model. First, plant growth measurements, a literature survey, and expert opinion were used to generate parameters manually which allowed a reasonable match of modeled data to measured data and generation of parameter constraints (Supplementary Table 1) for the multi-objective optimization. Then the manual parameters were fine-tuned with genetic programming in R. Starting with random values, a number of qualified parameter settings were identified after 200,000 computer iterations of optimization steps based on four sets of objectives, such that the differences between modeled and measurements for each of leaf area and masses of leaf, inflorescence and root were less than or equal to 1. The large number of qualified parameter settings were subjected to a hierarchical clustering algorithm to categorize Col-0 and gi-2 parameters into groups (Supplementary Table 2). From each cluster, the most representative and biologically feasible parameter settings were selected manually followed by further selection based on their best fit to leaf area and leaf mass.

