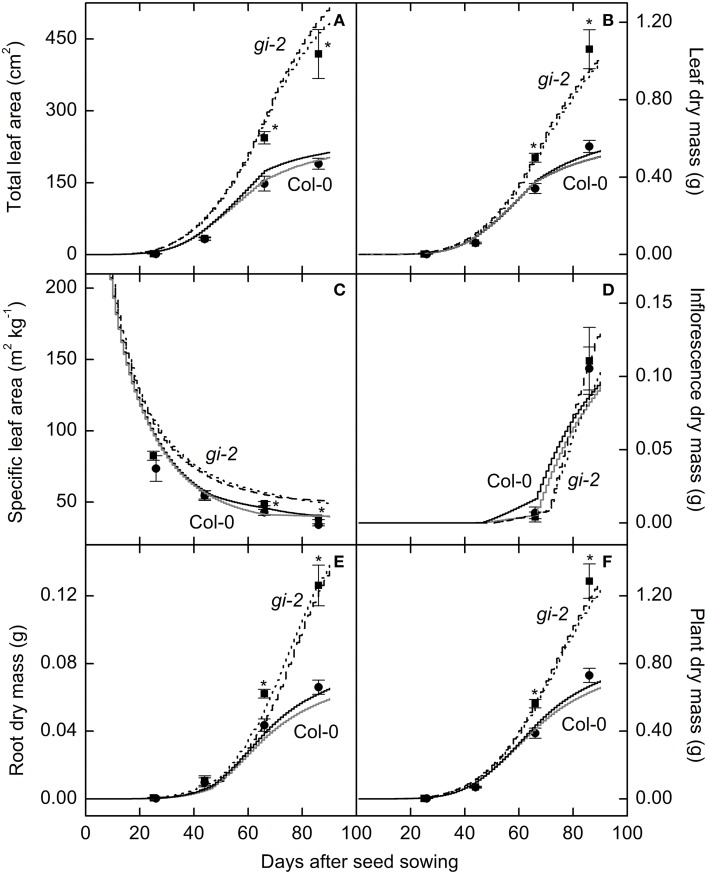
Figure 3.
Comparison of modeled and measured leaf and plant growth over time in Col-0 and gi-2. Modeled data generated using the selected parameter settings (Table 2) is compared to measured data for total leaf area (A), leaf dry mass (B), specific leaf area (C), and dry masses of the inflorescence (D), root (E), and the entire plant (F). Modeled data for Col-0 from simulation 1 (solid black lines) and simulation 2 (solid gray lines) and for gi-2 from simulation 1 (dotted lines) and 2 (dashed lines) is given. Simulated data is from 1 to 90 DAS. Measured data for Col-0 (filled circles) and gi-2 (filled squares) was initially taken at 26 DAS for Col-0 and 25 DAS for gi-2 and at 44, 66, 86 DAS for both lines. Measured values represent the mean ± SE and n = 10 plants per line. Measurements of gi-2 which showed a statistically significant difference from Col-0 at α = 0.05 are marked with an asterisk (*).

