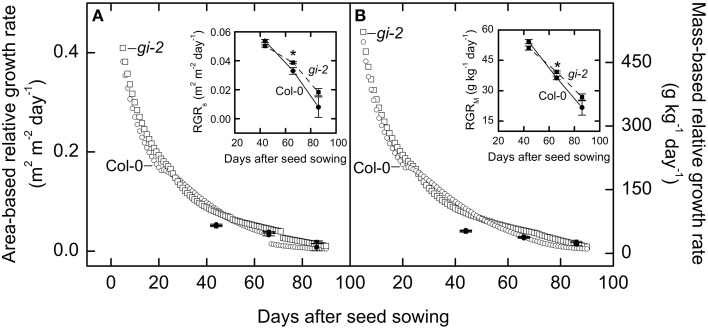
Figure 6.
Comparison of area-based and mass-based relative leaf growth rate over time in Col-0 and gi-2. Modeled data generated using partitioning coefficients in simulation 1 (Table 2) and measured data (also shown expanded in smaller panels) for area-based relative growth rate (RGRS) or relative increase in leaf area (A) and mass-based relative growth rate (RGRM) or relative increase in plant mass (B) for Col-0 and gi-2 is provided. Modeled data for Col-0 (open circles) and gi-2 (open squares) is simulated from 5 to 90 DAS. Relative growth rates measured for Col-0 (solid lines and filled circles) were calculated from 26 to 44 DAS, 44 to 66 DAS, and 66 to 86 DAS. Relative growth rates measured for gi-2 (dashed lines and filled squares) was calculated from 25 to 44 DAS, 44 to 66 DAS, and 66 to 86 DAS. For measured data, values represent the mean ± SE and n = 10 plants per line. Measurements of gi-2 which showed a statistically significant difference from Col-0 at α = 0.05 are marked with an asterisk (*).

