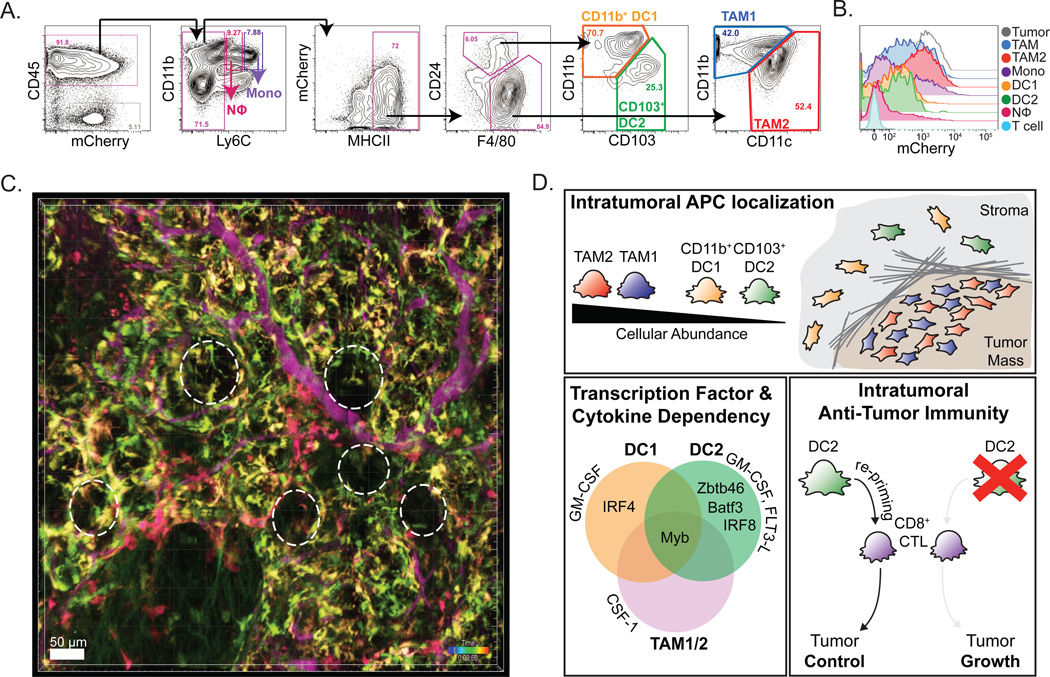
Figure 1. Parsing the Tumor Antigen-Presenting Cell Compartment.
(A) Flow cytometry and gating of tumor APC populations from digested and CD45-enriched PyMTchOVA tumor. Use of 9 different fluorophores to parse the myeloid compartment, revealing Monocytes (purple), Neutrophils (pink), CD11b+ DC (orange), CD103+ DC (green), TAM1 (blue) and TAM2 (red) populations (B) Histogram of tumor-derived mCherry fluorescence by tumor- infiltrating immune cells in a PyMTchOVA tumor, as a measure of endogenous tumor-antigen uptake. (C) Intravital 2-photon representative still image of an early carcinoma lesion from a PyMTchOVA × Cx3cr1-eGFP × Cd11c-mCherry reporter. Tumoral lesions indicated with dashed lines. Blood vessels are labeled (purple) with Evan’s Blue. Red (mCherry only cells = CD11b+ and CD103+ DC), yellow (mCherry and GFP double- positive cells = TAM2), and green (GFP only cells= TAM1) are shown. Scale bar = 50µm. (D) Summary cartoon of the tumor APC populations, their lineage factors and importance in CTL re-priming. Panels A and B were adapted from portions of figure 1 in ref. 28.

