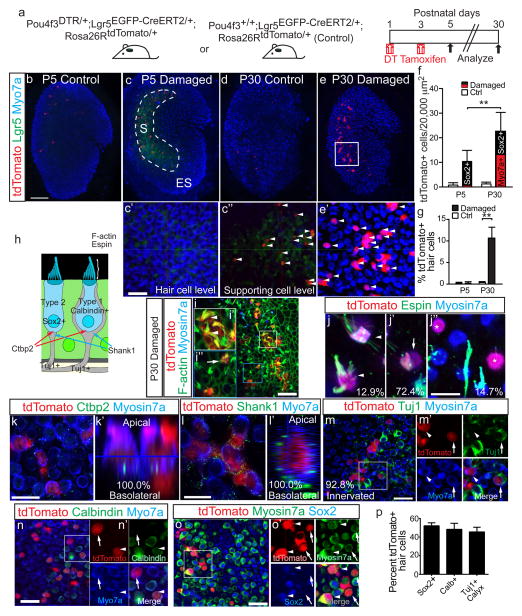
Figure 5. Lgr5+ cells act as hair cell progenitors in vivo.
(a) Schematic of the genetic approach to ablate hair cells and fate-map Lgr5+ cells in vivo. (b) In undamaged tissues, Lgr5-EGFP signal was absent and tamoxifen rarely induced tdTomato labeling at P5. (c) By contrast, damaged utricles showed many tdTomato+/Lgr5+/Myo7a-negative cells (arrowheads in c′–c″) at P5. (d) Undamaged organs showed rare tdTomato labeling at P30. (e) P30 damaged utricles had many tdTomato+/Myo7a+ cells (arrowheads). (f) Relative to P5, P30 had significantly more tdTomato+ and tdTomato+/Myo7a+ cells. At P5, almost all tdTomato+ cells were Myo7a-negative, whereas 60.6% expressed Myo7a at P30. (g) About 11% of striolar Myo7a+ hair cells (HCs) were tdTomato+ at P30. (h) Diagram illustrating Type I and II HCs. (i) Representative confocal images of P30 damaged and lineage-traced utricles, which contained tdTomato+/Myo7a+ cells with actin-enriched, bundle-like structures. (i′–i″) Lineage-traced HCs with long (arrowheads) and short stereocilia (arrow). (j–j″) Lineage-traced HCs showed long (j), and short (j′) espin+ stereocilia or were espin-negative and bundleless (j″, labeled by asterisks). (k) All tdTomato+/Myo7a+ cells examined expressed Ctbp2 on the basolateral surfaces. (k′) shows an orthogonal view of k. (l) Lineage-traced HCs were also juxtaposed to the postsynaptic protein Shank1. (l′) shows an orthogonal view of l. (m–m′) 92.8% of lineage-traced HCs were innervated by Tuj1+ neurites (arrowhead), a subset of which formed calyces (arrows). (n) Lineage-traced HCs were calbindin-negative (arrow) and –positive (arrowhead). (o–o′) Lineage-traced, Myo7a+ HCs were Sox2-positive (arrowheads) and –negative (arrows). (p) Quantification of lineage-traced HCs showed that about half were Sox2-negative (n=28 cells from 3 organs), calbindin-positive (n=47 cells from 3 organs), and surrounded by Tuj1+ calyces (asterisk) (n=37 cells from 3 organs). n=4–5 at P5, 26–28 in f–g. Data shown as mean±S.D. **p<0.01, Student’s t-tests. Scale bars, (b–e) 100 μm; (c′–e′, i and m–o) 20 μm; (k) 10 μm; (i′–i″, j–j″ and l) 5 μm.

