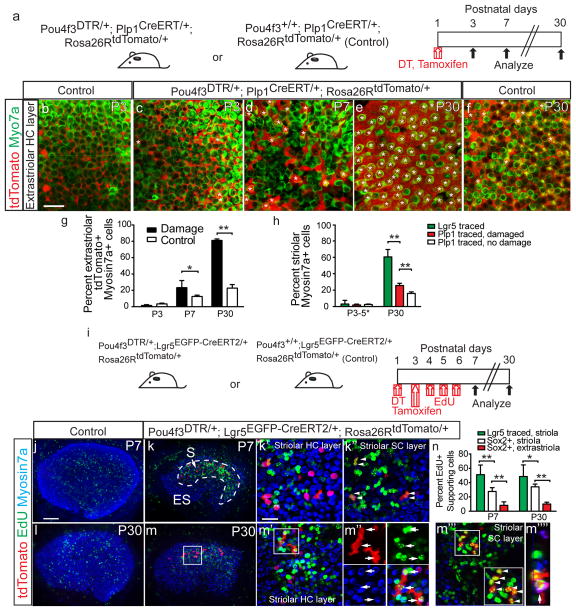
Figure 6. Striolar and extrastriolar supporting cells behave differently after damage.
(a) Schematic depicting the use of transgenic mice to ablate hair cells (HCs) and fate-map Plp1+ supporting cells (SCs). (b–c) Tamoxifen led to tdTomato labeling of extrastriolar SCs at P3 (also see Supplementary Fig. 4). (d–f) In both P7 undamaged (not shown) and damaged organs, a subset of Myo7a+ HCs were tdTomato+ (asterisks). Most extrastriolar HCs were tdTomato+ in the P30 damaged utricles, whereas only a subset of HCs were tdTomato+ in the P30 undamaged controls (f). (g) Quantification showed that damaged organs had significantly more lineage-traced HCs than undamaged controls in the extrastriolar region at P7 and P30 (n=520–1884 cells from 4–6 organs). (h) In the striolar region where Lgr5 was expressed after damage, significantly more HCs derived from the Lgr5+ than Plp1+ lineage (n=635 from 28 organs and 1,232 cells from 4 organs, respectively). (i) Schematic showing the use of transgenic mice to ablate HCs and fate-map Lgr5+ striolar SCs, and EdU to trace dividing cells. (j–m) Undamaged utricles contained few EdU-labeled cells in the sensory epithelium. Damage caused robust EdU-labeling in the striolar region, where lineage-traced Lgr5+ cells resided. At P7, most EdU+ cells were Myo7a-negative and resided in the SC layer, including EdU+, lineage-traced cells (arrowheads). At P30, many EdU+/tdTomato+/Myo7a+ HCs (arrowheads) were present. (m‴) Many EdU+/tdTomato+/Myo7a-negative SCs were also found at P30 (arrows). (m″″) shows an orthogonal view of m′ (n=602 cells from 6 organs). (n) Quantification of EdU-labeling showed that the Lgr5+ lineage (Myo7a-negative SCs in (m‴) was more proliferative than Sox2+ SCs in the striolar and extrastriolar regions (see Supplementary Fig. 5c, e). n=4–8 in g and n, and 4–28 in h (4–8 for P3–5, 28 for Lgr5 traced P30 organs, and 4–6 for Plp1 traced P30 organs). Data shown as mean±S.D. *p<0.05, **p<0.01, Student’s t-tests. Scale bars, (b–f, j–m) 100 μm; (k′, k″, m′, and m‴) 20 μm.

